ReporterScore
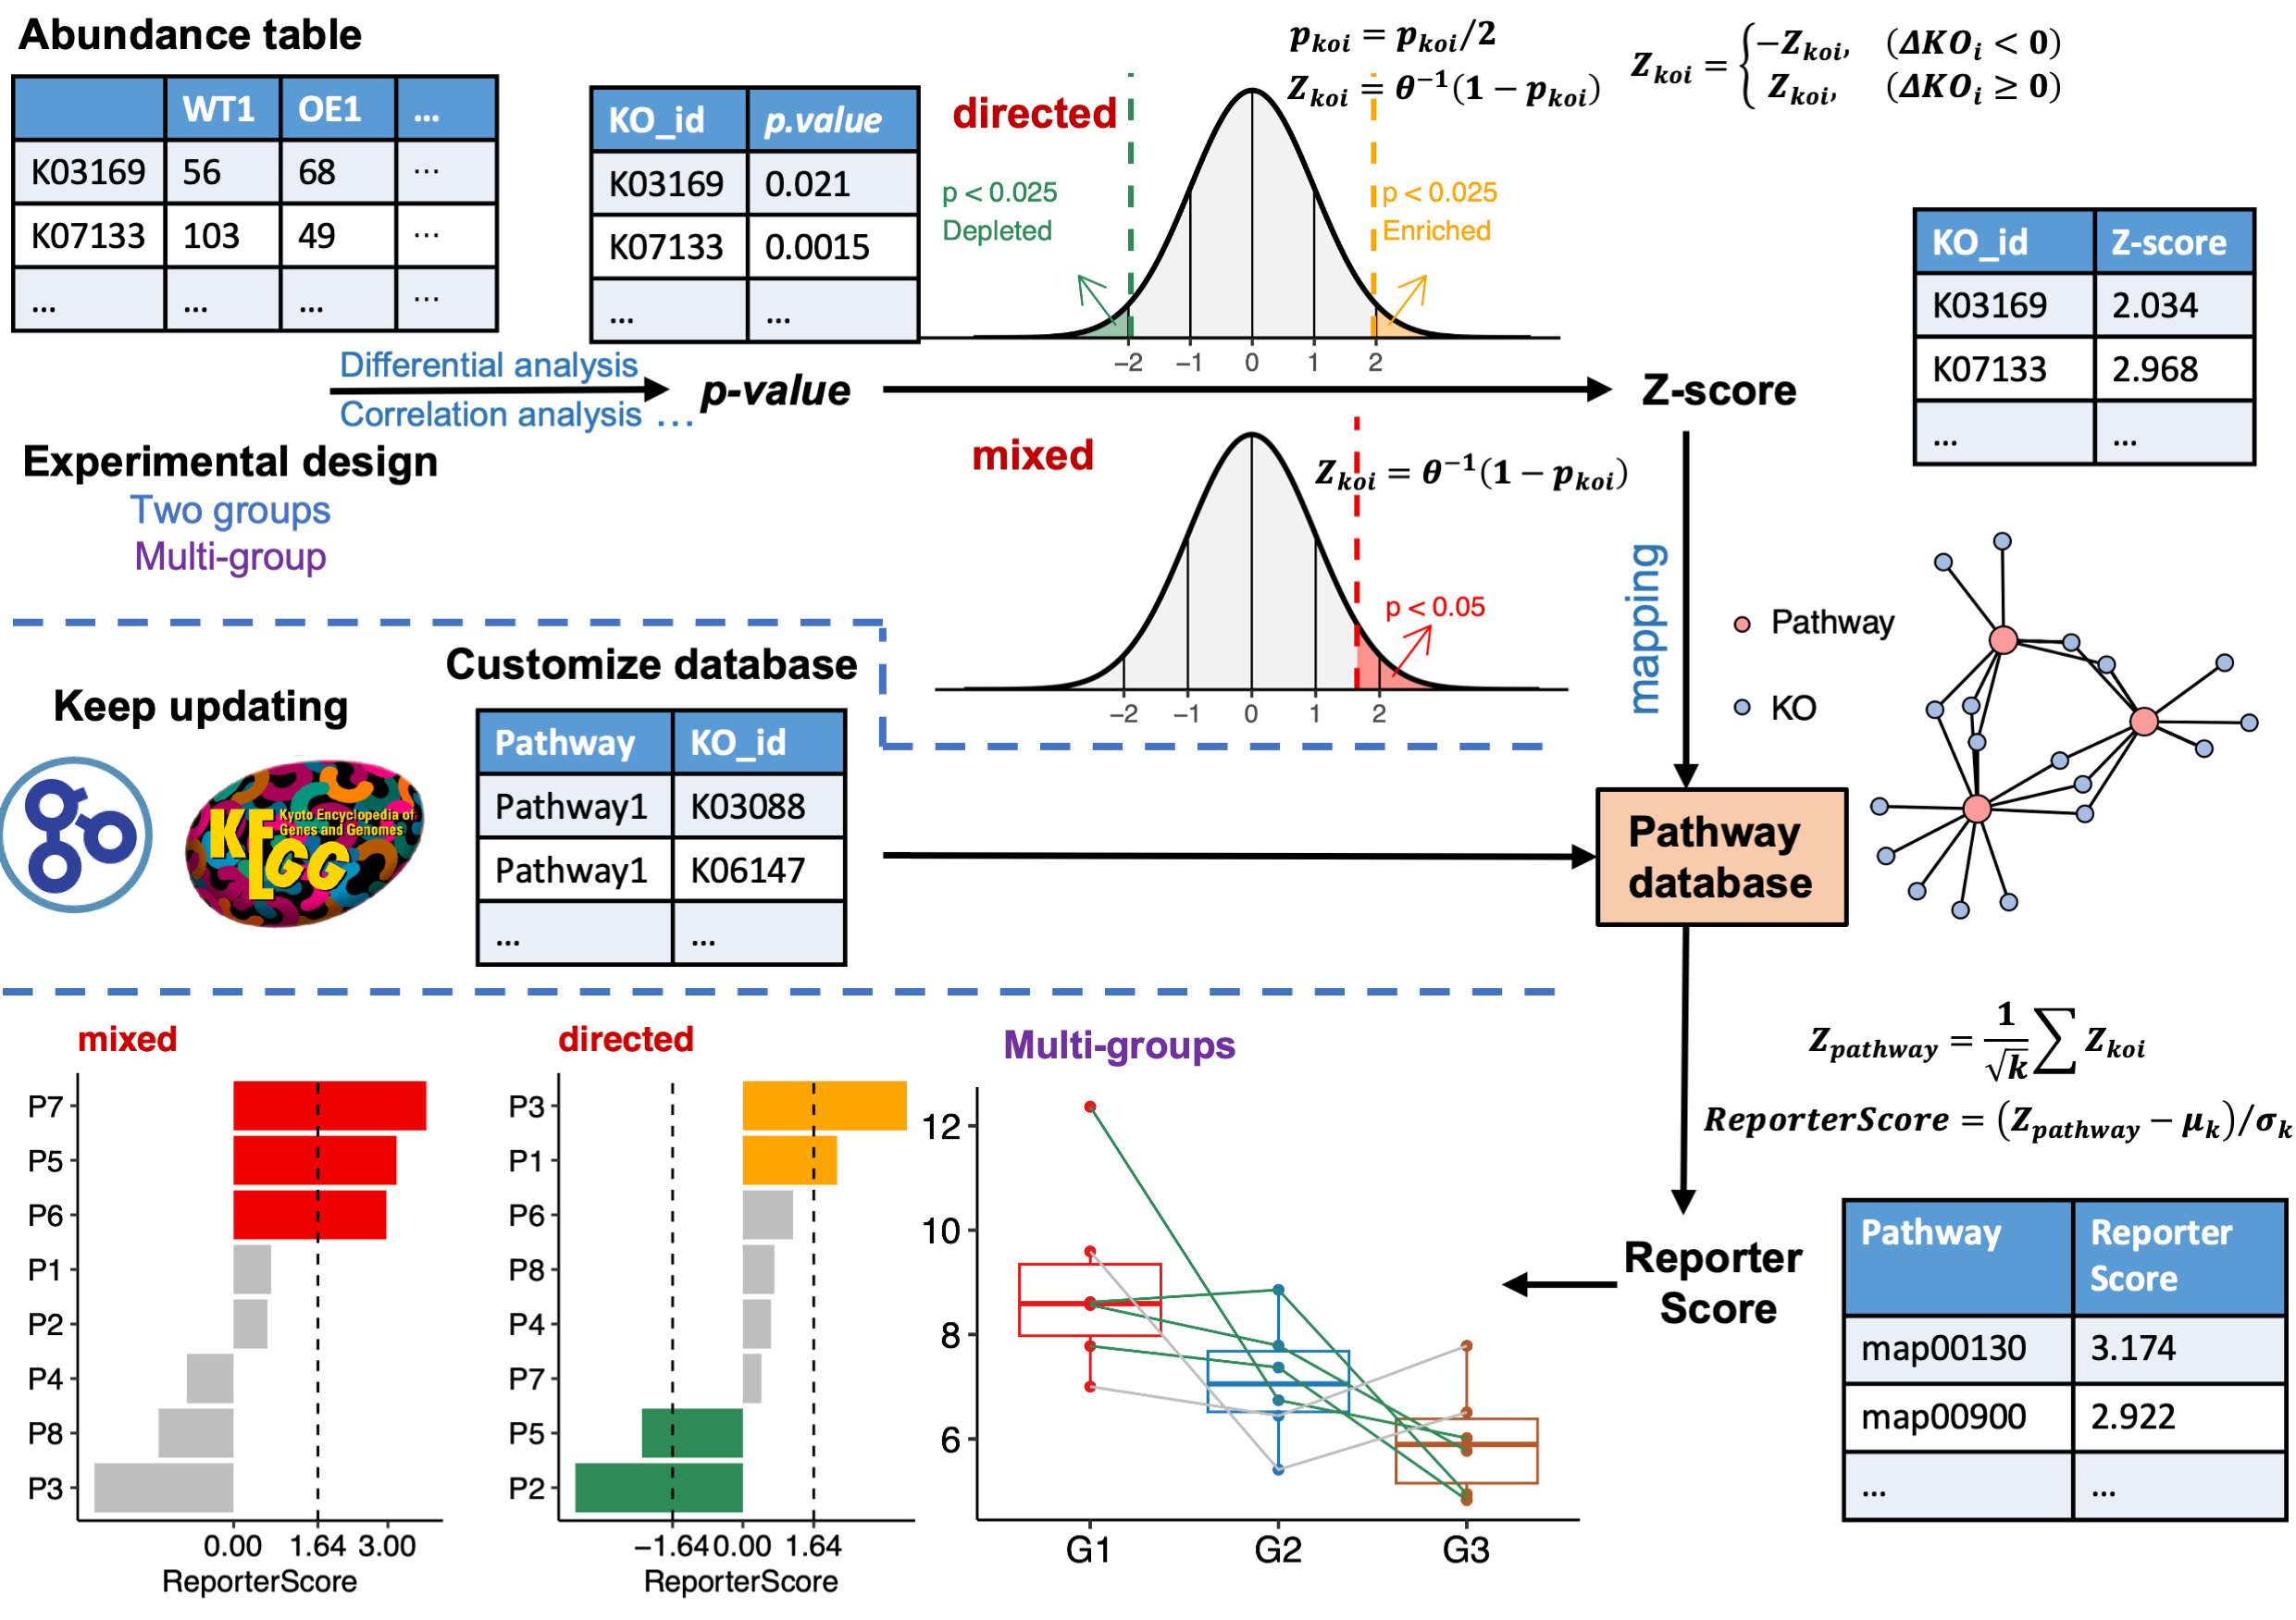
受经典RSA启发,我们开发了改进的广义报告评分分析(GRSA)方法,并在R包ReporterScore中实现了该方法,还集成了全面的可视化方法和通路数据库。
GRSA是一种无阈值方法,适用于所有类型的生物医学特征,如基因、化合物和微生物物种。GRSA可在mixed模式(经典RSA)和directed模式(增强RSA)下工作。directed模式使用报告评分的符号区分上调或下调的通路,所以更直观。
重要的是,GRSA支持多组和纵向实验设计,因为它包含了与多组和纵向实验设计兼容的统计方法。 ReporterScore包还支持自定义的分层和关系数据库,为高级用户提供额外的灵活性。
最新版本的HTML文档可在Github 主页找到.
引用
在出版物中引用ReporterScore:
C. Peng, Q. Chen, S. Tan, X. Shen, C. Jiang, Generalized Reporter Score-based Enrichment Analysis for Omics Data. Briefings in Bioinformatics (2024). https://doi.org/10.1093/bib/bbae116.
安装
您可以从CRAN安装已发布版本的ReporterScore:
install.packages("ReporterScore")也可以从GitHub安装开发版本 ReporterScore:
# install.packages("devtools")
devtools::install_github("Asa12138/pcutils")
devtools::install_github("Asa12138/ReporterScore")
使用
1. 输入数据(特征丰度表和元数据)
- 对于特定物种的转录组、单细胞RNA-seq和相关基因组学数据,可以使用完整的基因丰度表。
- 对于涉及多种不同物种的宏基因组和宏转录组数据,可以使用KO丰度表,使用Blast、Diamond或KEGG官方映射软件来将reads或contigs对齐到KEGG或EggNOG数据库。
- 对于代谢组数据,可以使用已注释的化合物丰度表,但需要进行化合物ID的标准化(例如,将化合物ID转换为KEGG数据库中的C编号)。
丰度表的格式:
⚠️ 重要提示:输入的丰度表不应进行预过滤(保留背景信息),因为‘GRSA’是一种无阈值的方法。
- 行名为特征ID(例如,“K00001”(KEGG K号)如果特征为“ko”;“PEX11A”(基因符号)如果特征为“gene”;“C00024”(KEGG C号)如果特征为“compound”)。
- 列名为样本。
- 丰度值可以是读数count或标准化值(例如TPM、FPKM、RPKM或相对丰度),对应适当的统计检验方法。
适用于KO丰度表的示例代码如下:
data("KO_abundance_test")
head(KO_abundance[, 1:6])
#>                WT1         WT2         WT3         WT4         WT5         WT6
#> K03169 0.002653545 0.005096380 0.002033923 0.000722349 0.003468322 0.001483028
#> K07133 0.000308237 0.000280458 0.000596527 0.000859854 0.000308719 0.000878098
#> K03088 0.002147068 0.002030742 0.003797459 0.004161979 0.002076596 0.003091182
#> K03530 0.003788366 0.000239298 0.000445817 0.000557271 0.000222969 0.000529624
#> K06147 0.000785654 0.001213630 0.001312569 0.001662740 0.002387006 0.001725797
#> K05349 0.001816325 0.002813642 0.003274701 0.001089906 0.002371921 0.001795214
你还应该提供一个实验设计元数据:
元数据表的格式:
- 行名为样本,列名为分组。
- 分组变量可以是类别(至少包含两个类别,用于差异丰度分析)。
- 分组变量也可以是多个时间点(用于纵向分析)。
- 分组变量也可以是连续变量(用于相关性分析)。
head(metadata)
#>     Group Group2
#> WT1    WT     G3
#> WT2    WT     G3
#> WT3    WT     G3
#> WT4    WT     G3
#> WT5    WT     G3
#> WT6    WT     G1
⚠️ 重要提示:元数据的行名和特征丰度表的列名应该匹配或部分匹配!
ReporterScore 将根据元数据的行名和特征丰度表的列名自动进行样本匹配。
2. 通路数据库
ReporterScore 包含内置的KEGG通路、模块、基因、化合物和GO数据库,并支持自定义数据库,使其能够兼容来自多种组学数据的特征丰度表。
你可以根据自己的分析需求选择以下任一方法来加载数据库:
对于KO丰度表,
ReporterScore包含内置的KEGG通路-KO和模块-KO数据库(2023-08版本)。您可以使用load_KOlist()查看这些数据库,并使用update_KO_file()更新这些数据库(通过KEGG API),保持数据库的最新性非常重要。对于化合物丰度表,
ReporterScore包含内置的KEGG通路-化合物和模块-化合物数据库(2023-08版本)。您可以使用load_CPDlist()查看这些数据库,并使用update_KO_file()更新这些数据库(通过KEGG API)。对于KO、基因和化合物丰度表,
ReporterScore包含人类(hsa)和小鼠(mmu)的内置通路-ko、通路-基因和通路-化合物数据库。您可以使用custom_modulelist_from_org()查看这些数据库。使用update_org_pathway()更新这些数据库,并下载其他生物数据库(通过KEGG API)。ReporterScore包含内置的GO-基因数据库。您可以使用load_GOlist()查看这些数据库,并使用update_GOlist()更新这些数据库(通过KEGG API)。您可以通过使用
custom_modulelist()自定义您自己的通路数据库(感兴趣的基因集)。
# 1. KEGG pathway-KO and module-KO databases
KOlist <- load_KOlist()
head(KOlist$pathway)

# 2. KEGG pathway-compound and module-compound databases
CPDlist <- load_CPDlist()
head(CPDlist$pathway)

# 3. human (hsa) pathway-ko/gene/compound databases
hsa_pathway_gene <- custom_modulelist_from_org(
  org = "hsa",
  feature = c("ko", "gene", "compound")[2]
)
head(hsa_pathway_gene)

# 4. GO-gene database
GOlist <- load_GOlist()
head(GOlist$BP)

# 5. 自定义自己的通路数据库
?custom_modulelist()
3. 一步GRSA
使用函数 GRSA 或 reporter_score 可以一步得到Reporter Score结果。
⚠️分析中有一些重要的参数:
-
mode: “mixed” 或 “directed”(仅用于两组差异分析或多组相关分析。详情见
pvalue2zs)。 -
method: 计算p值的统计测试方法。默认为
wilcox.test:-
t.test(参数检验)和wilcox.test(非参数检验)。用于比较两组样本。 -
anova(参数检验)和kruskal.test(非参数检验)。执行单因素方差分析或Kruskal-Wallis秩和检验,比较多个组。 - “pearson”、“kendall” 或 “spearman”(相关性检验),参见
cor。 - “none”: 使用“none”进行“逐步富集”计算p值。您可以使用“DESeq2”、“Edger”、“Limma”、“ALDEX”、“ANCOM”等其他方法自行计算p值。
-
-
type: 选择内置的通路数据库:
- ‘pathway’ 或 ‘module’ 默认KEGG数据库适用于微生物组。
- ‘CC’, ‘MF’, ‘BP’, ‘ALL’ 默认GO数据库适用于人类。
- org 列在 https://www.genome.jp/kegg/catalog/org_list.html 中,例如 ‘hsa’(如果您的kodf来自特定的生物体,您应在此处指定type)。
-
modulelist: 自定义数据库。包含 ‘id’,‘K_num’,‘KOs’,‘Description’ 列的数据框。以
KOlist为例,使用custom_modulelist构建自定义数据库。 - feature: “ko”, “gene”, “compound” 中的一个。
分组中第一个将被设置为对照组,您可以更改因子水平以改变比较。
例如,我们想比较两组 ‘WT-OE’,并使用“directed”模式,因为我们只需要知道OE组中哪些通路上调或下调(反过来就是WT组通路下调或上调):
KO-pathway
cat("Comparison: ", levels(factor(metadata$Group)), "\n")
#> Comparison:  WT OE

# for microbiome!!!
reporter_res <- GRSA(KO_abundance, "Group", metadata,
  mode = "directed",
  method = "wilcox.test", perm = 999,
  type = "pathway", feature = "ko"
)
#> ================================Use feature: ko=================================
#> ===============================Checking rownames================================
#> Some of your ko_stat are not KO id, check the format! (e.g. K00001)
#> 52.7% of your kos in the modulelist!
#> 30 samples are matched for next step.
#> ===========================Removing all-zero rows: 0============================
#> ===================================1.KO test====================================
#> =================================Checking group=================================
#> 30 samples are matched for next step.
#> ===========================Removing all-zero rows: 0============================
#> ==============================Calculating each KO===============================
#> ===========================Using method: wilcox.test============================
#> 1000 features done.
#> 2000 features done.
#> 3000 features done.
#> 4000 features done.
#>
#> Compared groups: WT, OE
#> Total KO number: 4535
#> Compare method: wilcox.test
#> Time use: 1.179
#> =========================2.Transfer p.value to Z-score==========================
#> ==========================3.Calculating reporter score==========================
#> ==================================load KOlist===================================
#> ===================KOlist download time: 2023-08-14 16:00:52====================
#> If you want to update KOlist, use `update_KO_file()`
#> ============================Calculating each pathway============================
#> 100 pathways done.
#> 400 pathways done.
#> ID number: 481
#> Time use: 1.689
#> ====================================All done====================================
Gene-pathway
当您使用特定物种(例如人类)的基因丰度表时,请记得设置 feature 和 type 参数!或者通过 modulelist 提供数据库:
data("genedf")

# 方法 1: 设置 `feature` 和 `type` 参数
reporter_res_gene <- GRSA(genedf, "Group", metadata,
  mode = "directed",
  method = "wilcox.test", perm = 999,
  type = "hsa", feature = "gene"
)
#> ===============================Use feature: gene================================
#> ===============================Checking rownames================================
#> please make sure your input table rows are gene symbol!
#> 100% of your genes in the modulelist!
#> 30 samples are matched for next step.
#> ===========================Removing all-zero rows: 0============================
#> ===================================1.KO test====================================
#> =================================Checking group=================================
#> 30 samples are matched for next step.
#> ===========================Removing all-zero rows: 0============================
#> ==============================Calculating each KO===============================
#> ===========================Using method: wilcox.test============================
#> 1000 features done.
#>
#> Compared groups: WT, OE
#> Total KO number: 1000
#> Compare method: wilcox.test
#> Time use: 0.224
#> =========================2.Transfer p.value to Z-score==========================
#> ==========================3.Calculating reporter score==========================
#> ================================load hsa pathway================================
#> =================hsa pathway download time: 2023-08-14 23:28:13=================
#> If you want to update hsa pathway, use `update_org_pathway('hsa')`
#> please assgin this custom modulelist to `reporter_score(modulelist=your_modulelist)` to do a custom enrichment.
#> You choose the feature: 'gene', make sure the rownames of your input table are right.
#> ============================Calculating each pathway============================
#> 100 pathways done.
#> 150 pathways done.
#> 200 pathways done.
#> 250 pathways done.
#> 300 pathways done.
#> ID number: 343
#> Time use: 1.558
#> ====================================All done====================================
# 方法 2: 通过`modulelist`给出数据库,结果与方法1相同.
hsa_pathway_gene <- custom_modulelist_from_org(
  org = "hsa",
  feature = "gene"
)

reporter_res_gene <- GRSA(genedf, "Group", metadata,
  mode = "directed",
  method = "wilcox.test", perm = 999,
  modulelist = hsa_pathway_gene
)
library(patchwork)
p1 <- plot_report_bar(reporter_res_gene, rs_threshold = 2)

# 使用`modify_description`删除通路描述的后缀
reporter_res_gene2 <- modify_description(reporter_res_gene, pattern = " - Homo sapiens (human)")
p2 <- plot_report_bar(reporter_res_gene2, rs_threshold = 2)

# 使用“ggplot_translator”翻译通路描述
p3 <- pcutils::ggplot_translator(p2)
#> Please set the font family to make the labels display well.
#>  see `how_to_set_font_for_plot()`.

p1 / p2 / p3
Compound-pathway
当您使用化合物丰度表时,请记得设置 feature 和 type 参数!或者通过 modulelist 提供数据库。
reporter_res_gene <- GRSA(chem_df, "Group", metadata,
  mode = "directed",
  method = "wilcox.test", perm = 999,
  type = "hsa", feature = "compound"
)
输出结果
结果是一个“reporter_score”对象:
| 元素 | 描述 |
|---|---|
kodf |
您的输入KO丰度表 |
ko_stat |
KO统计结果,包含p值和z分数 |
reporter_s |
每个通路中的报告者分数 |
modulelist |
默认的KOlist或自定义的模块列表数据框 |
group |
您数据中的比较组 |
metadata |
包含样本信息的数据框,包括组信息 |
重要的结果是 reporter_res$reporter_s,它是一个包含每个通路中报告者分数的数据框:
# 在Rstudio中查看data.frame
View(reporter_res$reporter_s)

# 将结果导出为.csv格式,并使用Excel进行查看:
export_report_table(reporter_res, dir_name = "~/Downloads/")
4. 可视化
在获得Reporter Score结果后,我们可以通过多种方式进行可视化。
当我们关注整体结果时:
- 绘制显著富集的通路:
您可以设置 rs_threshold 来过滤部分通路, 默认的 rs_threshold 是 1.64, 对应的显著性水平为 0.05。
# View(reporter_res$reporter_s)
plot_report_bar(reporter_res, rs_threshold = c(-2.5, 2.5), facet_level = TRUE)
#> ==============================load Pathway_htable===============================
#> ===============Pathway_htable download time: 2024-01-12 00:52:39================
#> If you want to update Pathway_htable, use `update_htable(type='pathway')`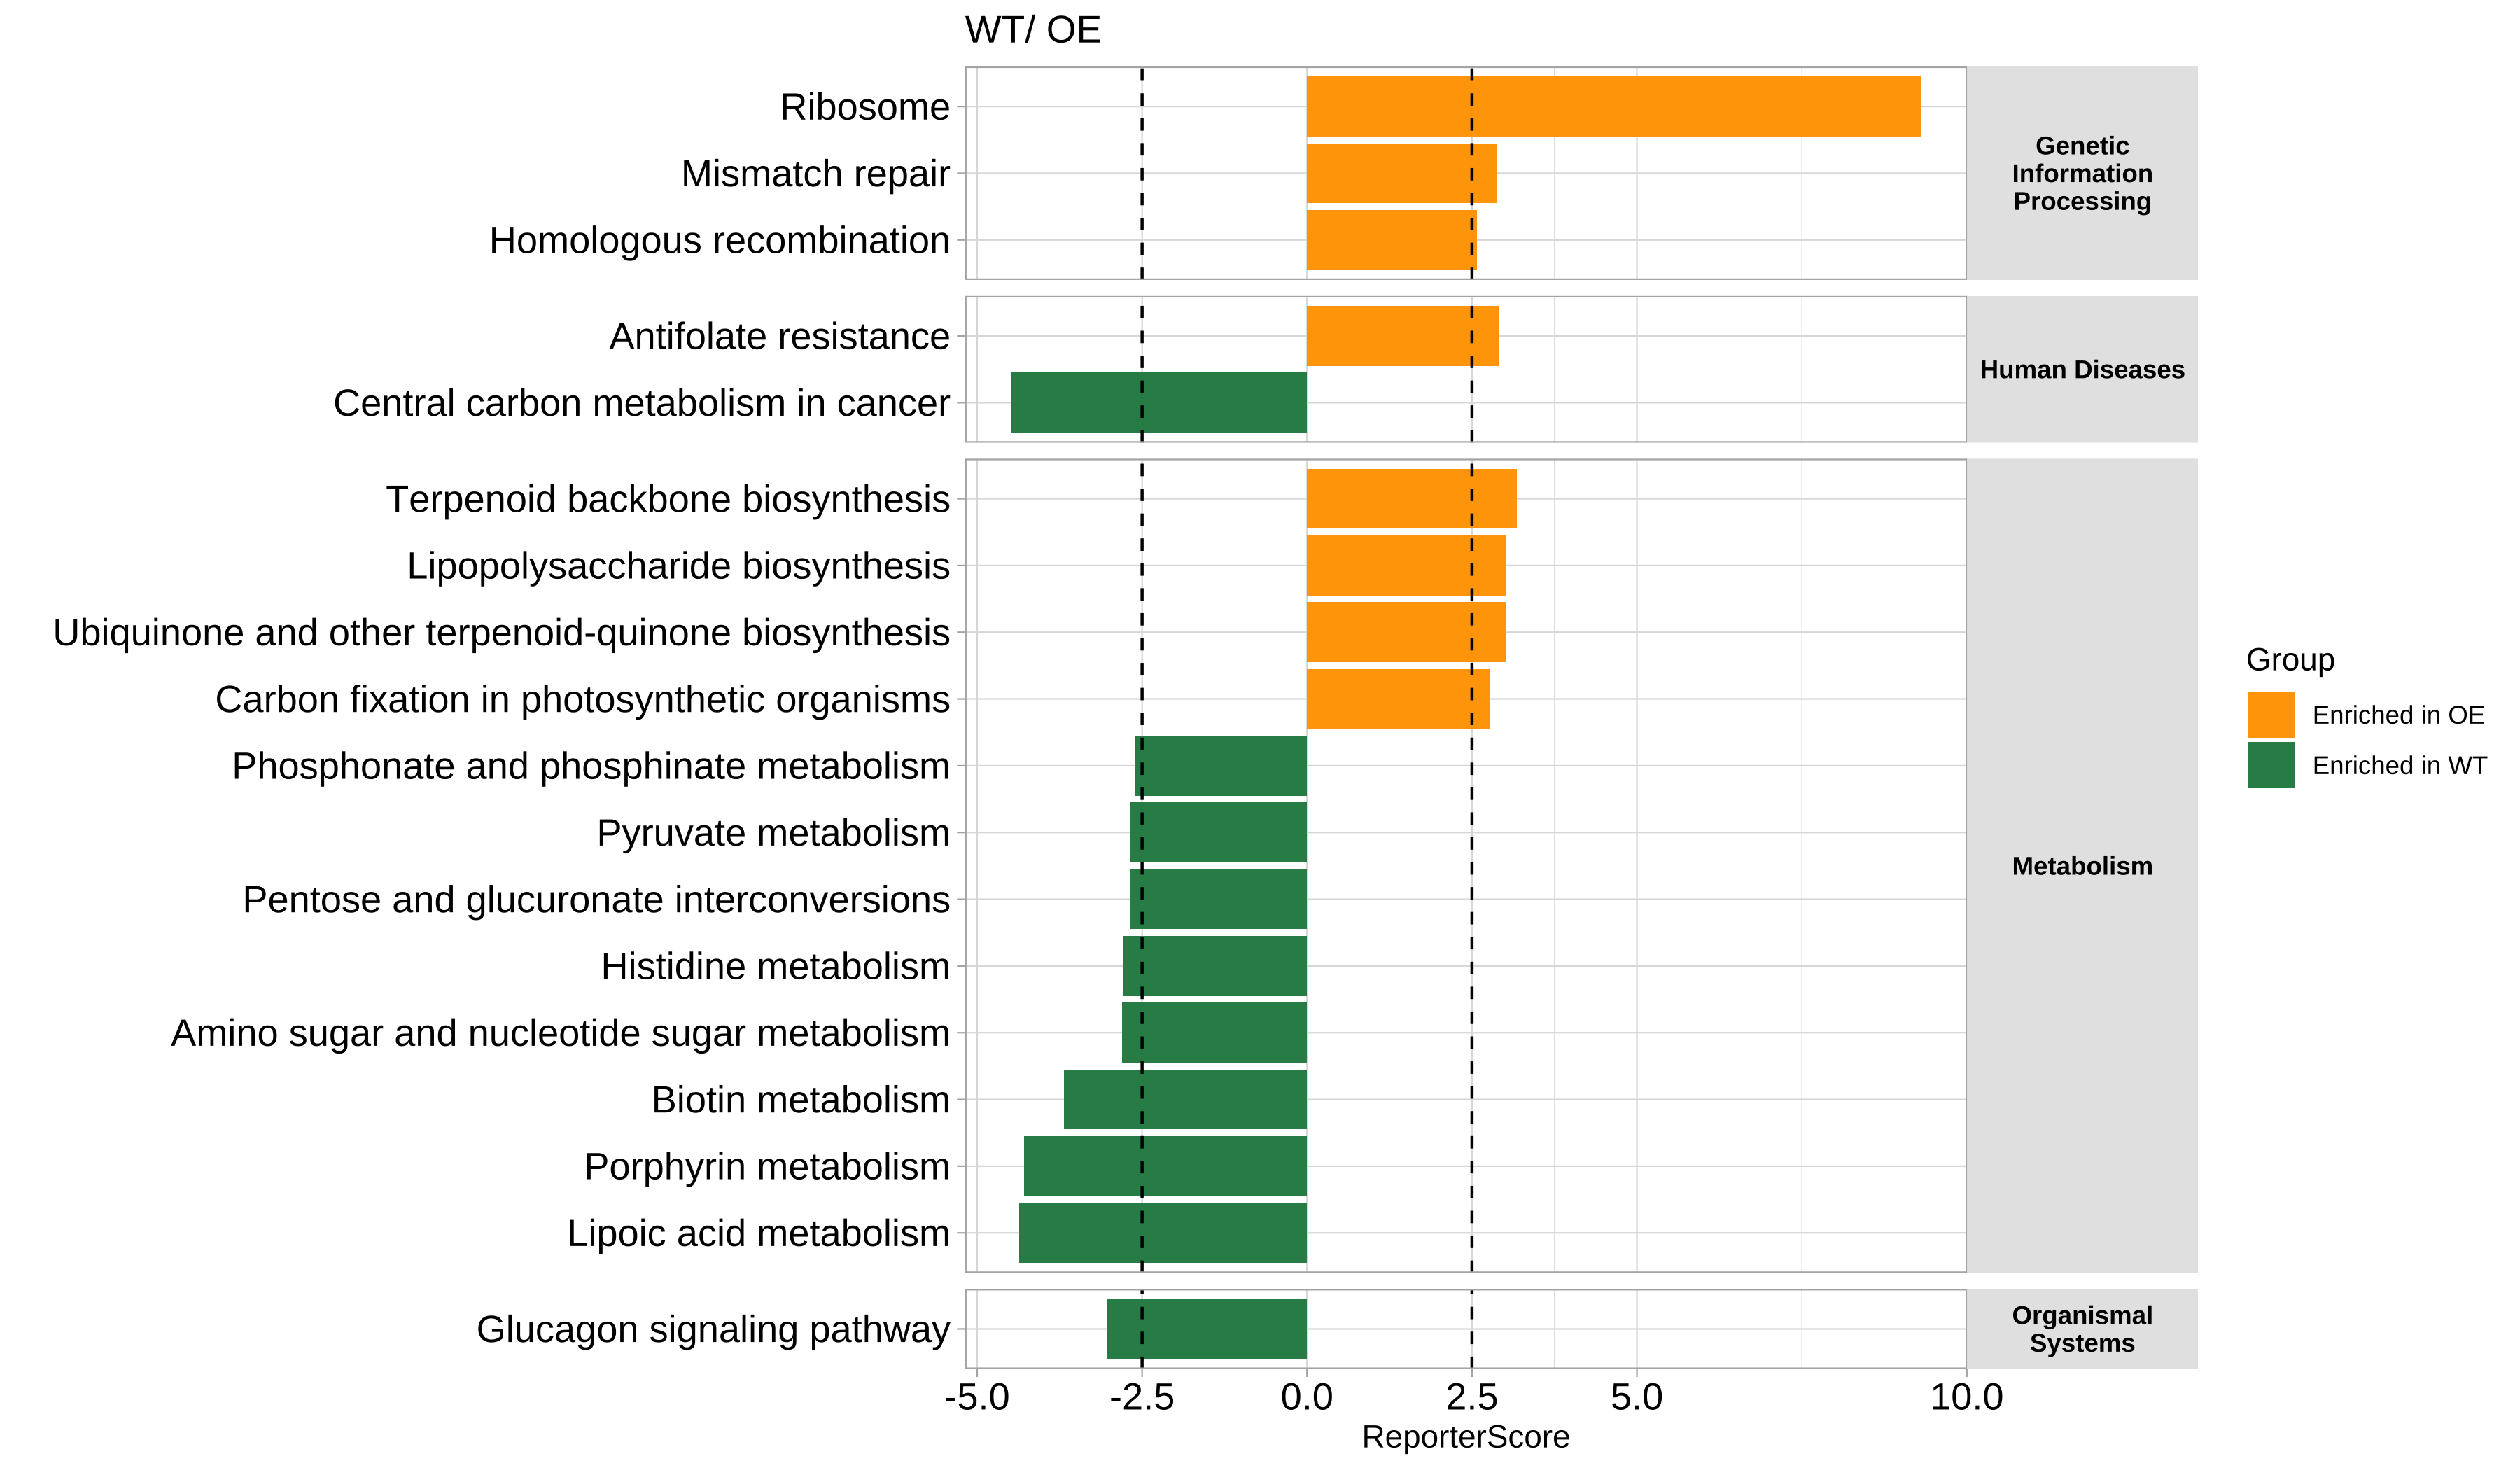
⚠️在directed模式下,富集在一个组中意味着在另一个组中下调。
- 绘制最显著富集的通路(珠包图):
plot_report_circle_packing(reporter_res, rs_threshold = c(-2.5, 2.5))
#> ==============================load Pathway_htable===============================
#> ===============Pathway_htable download time: 2024-01-12 00:52:39================
#> If you want to update Pathway_htable, use `update_htable(type='pathway')`
#> Non-leaf weights ignored
#> Scale for fill is already present.
#> Adding another scale for fill, which will replace the existing scale.
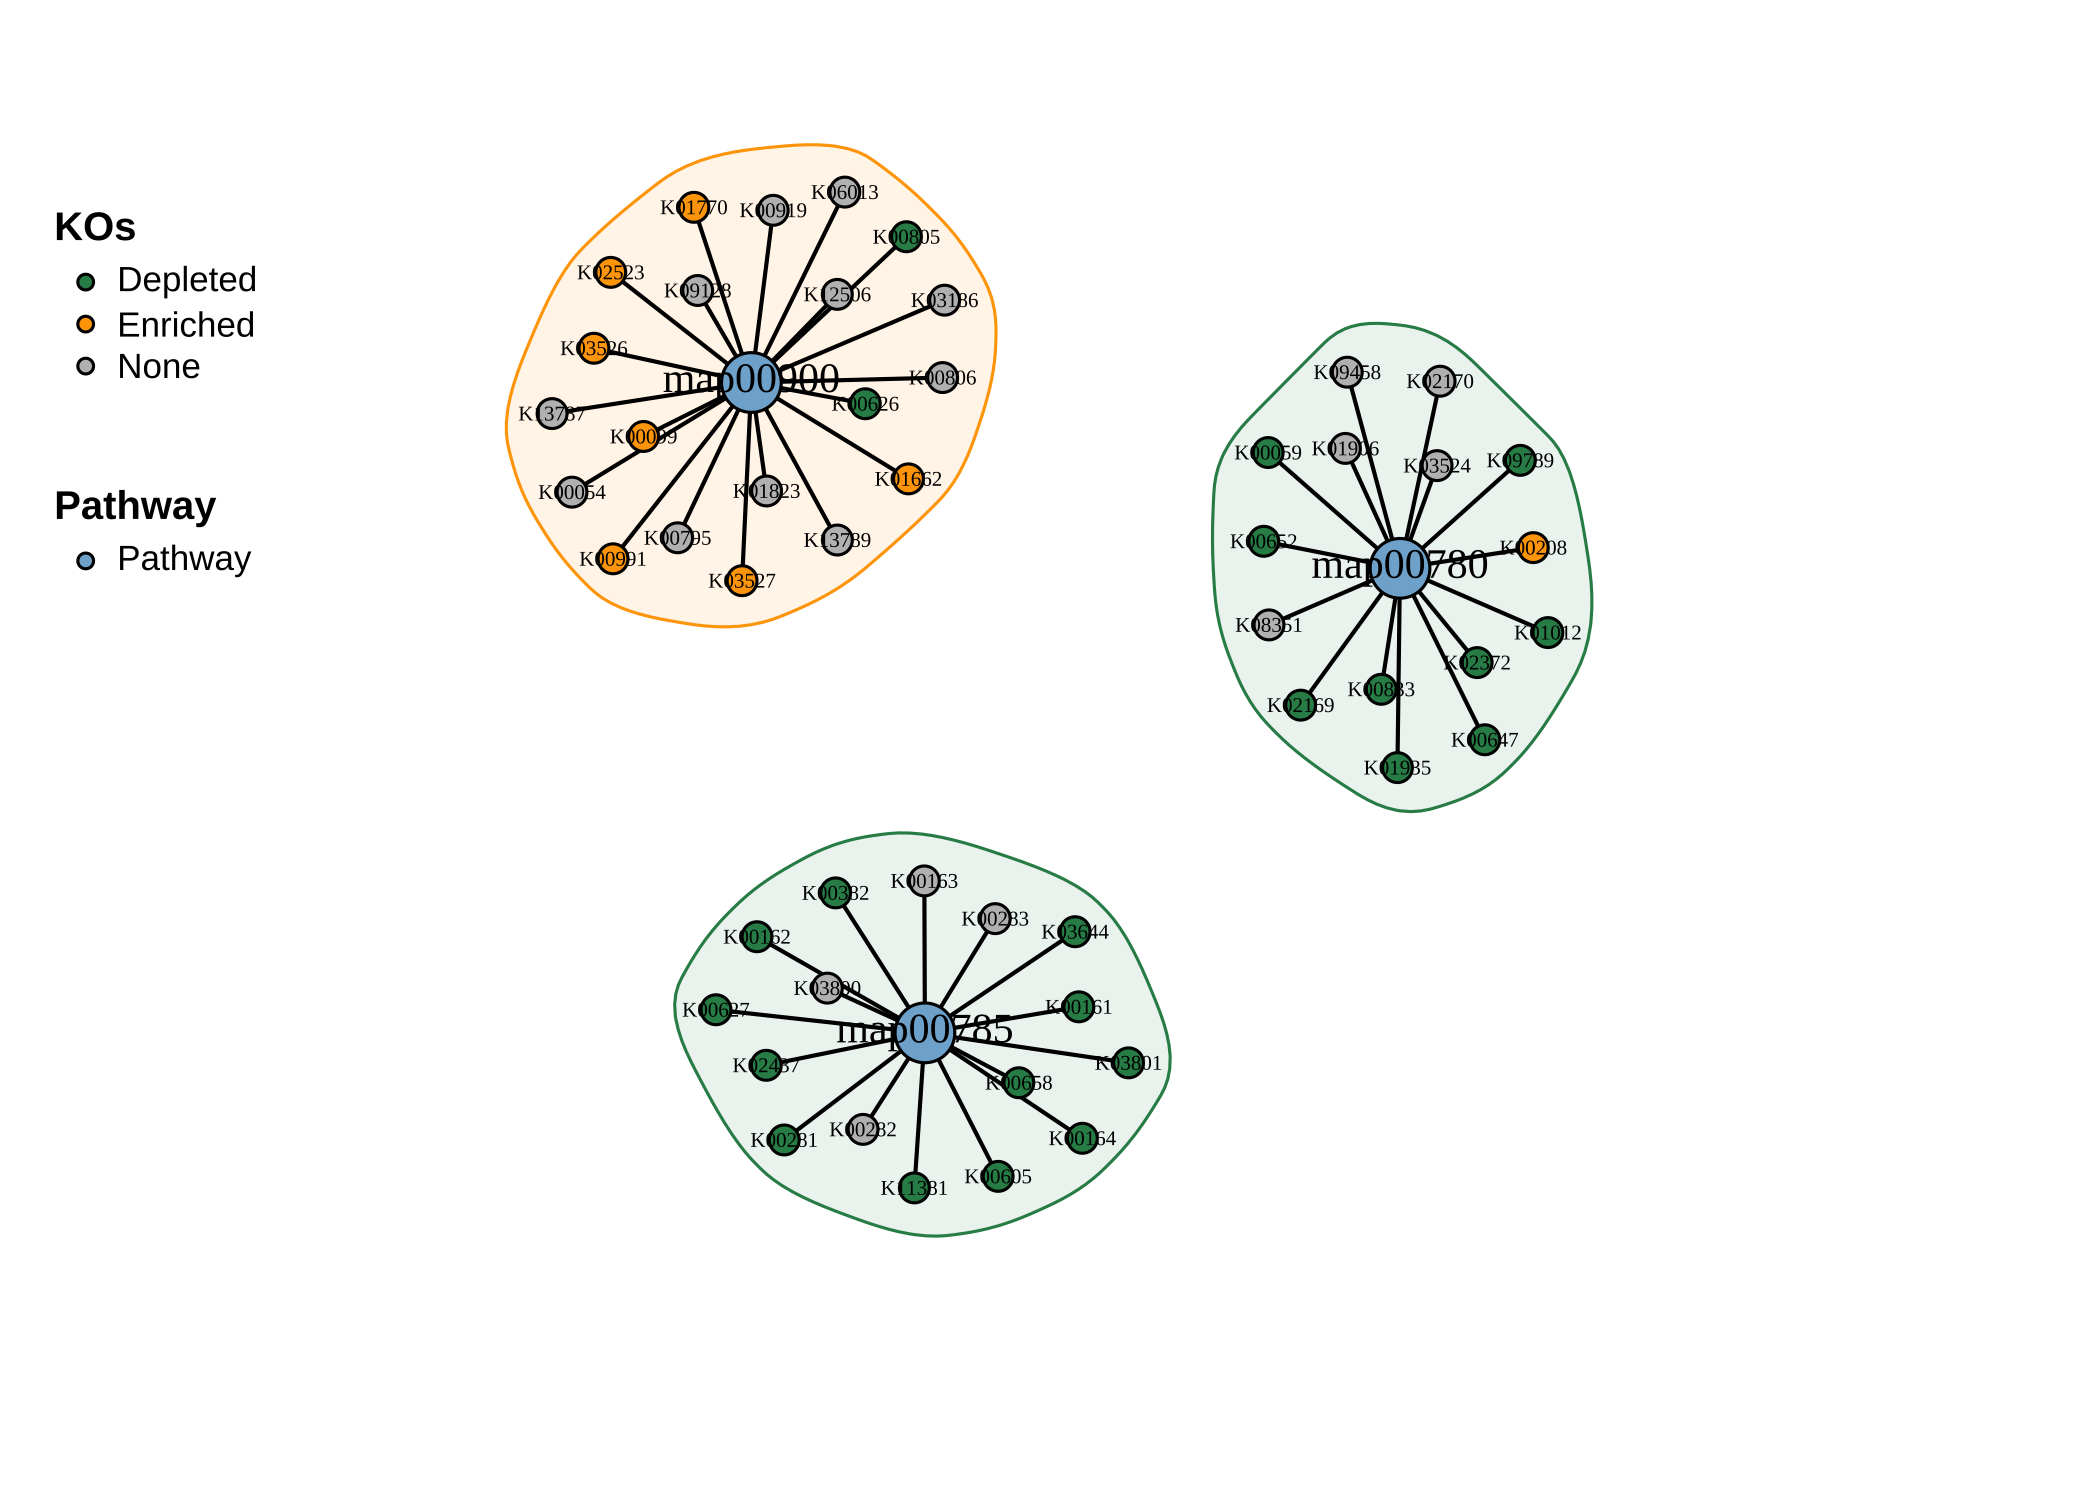
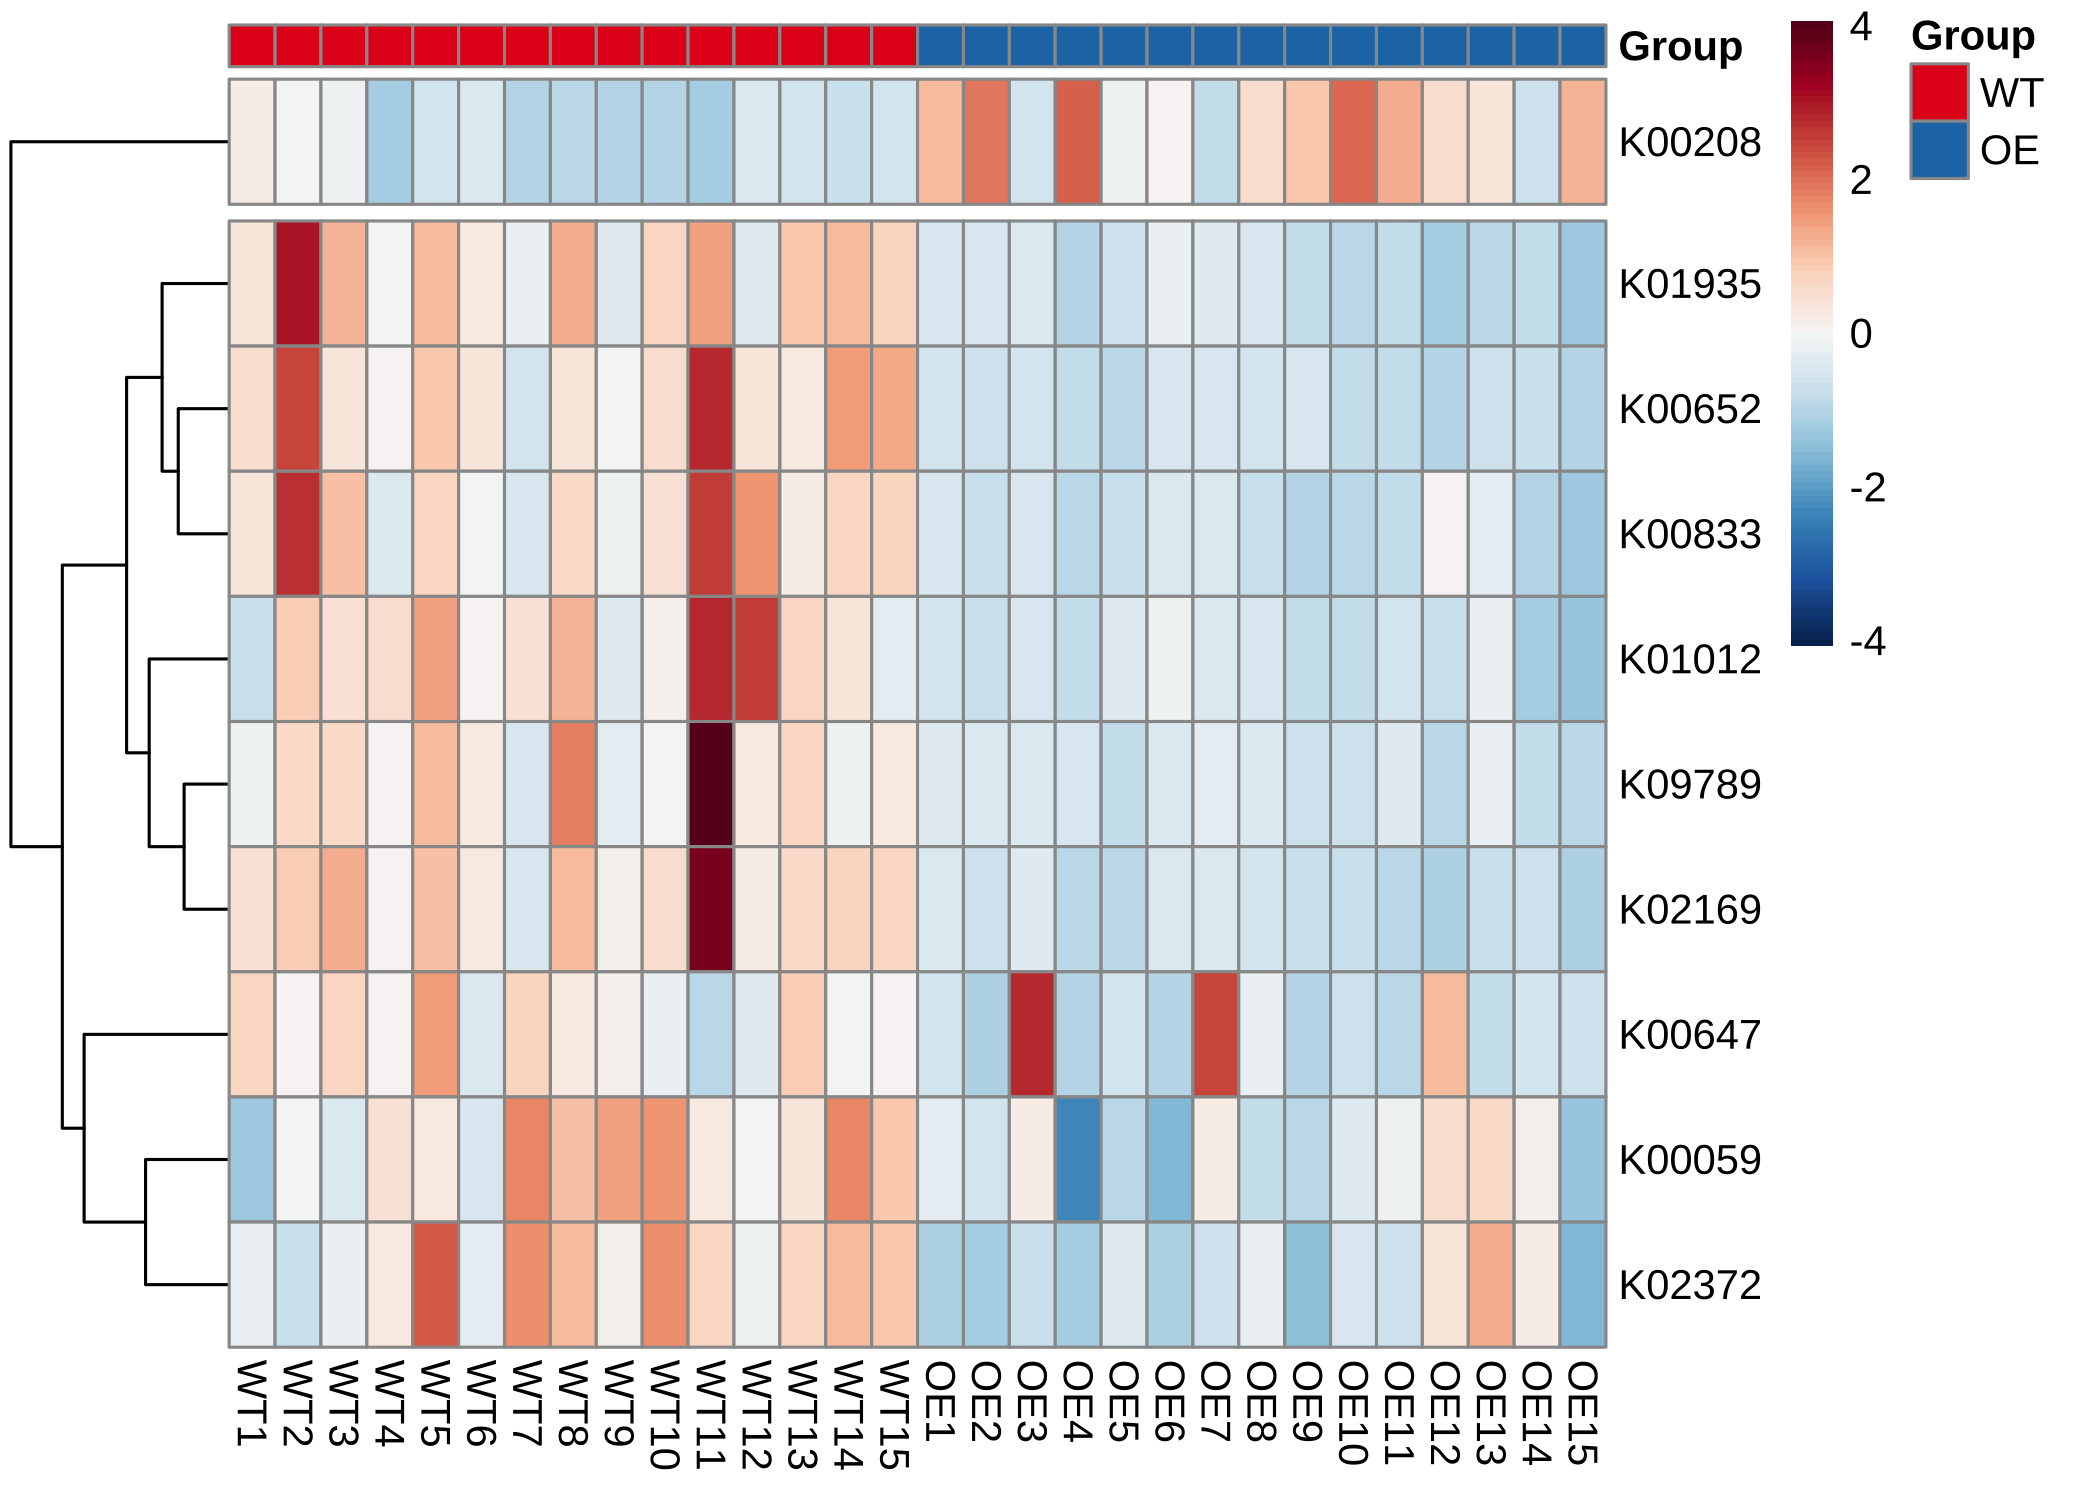
当我们关注一条通路时,例如“map00780”:
- 绘制箱线图:
plot_KOs_in_pathway(reporter_res, map_id = "map00780")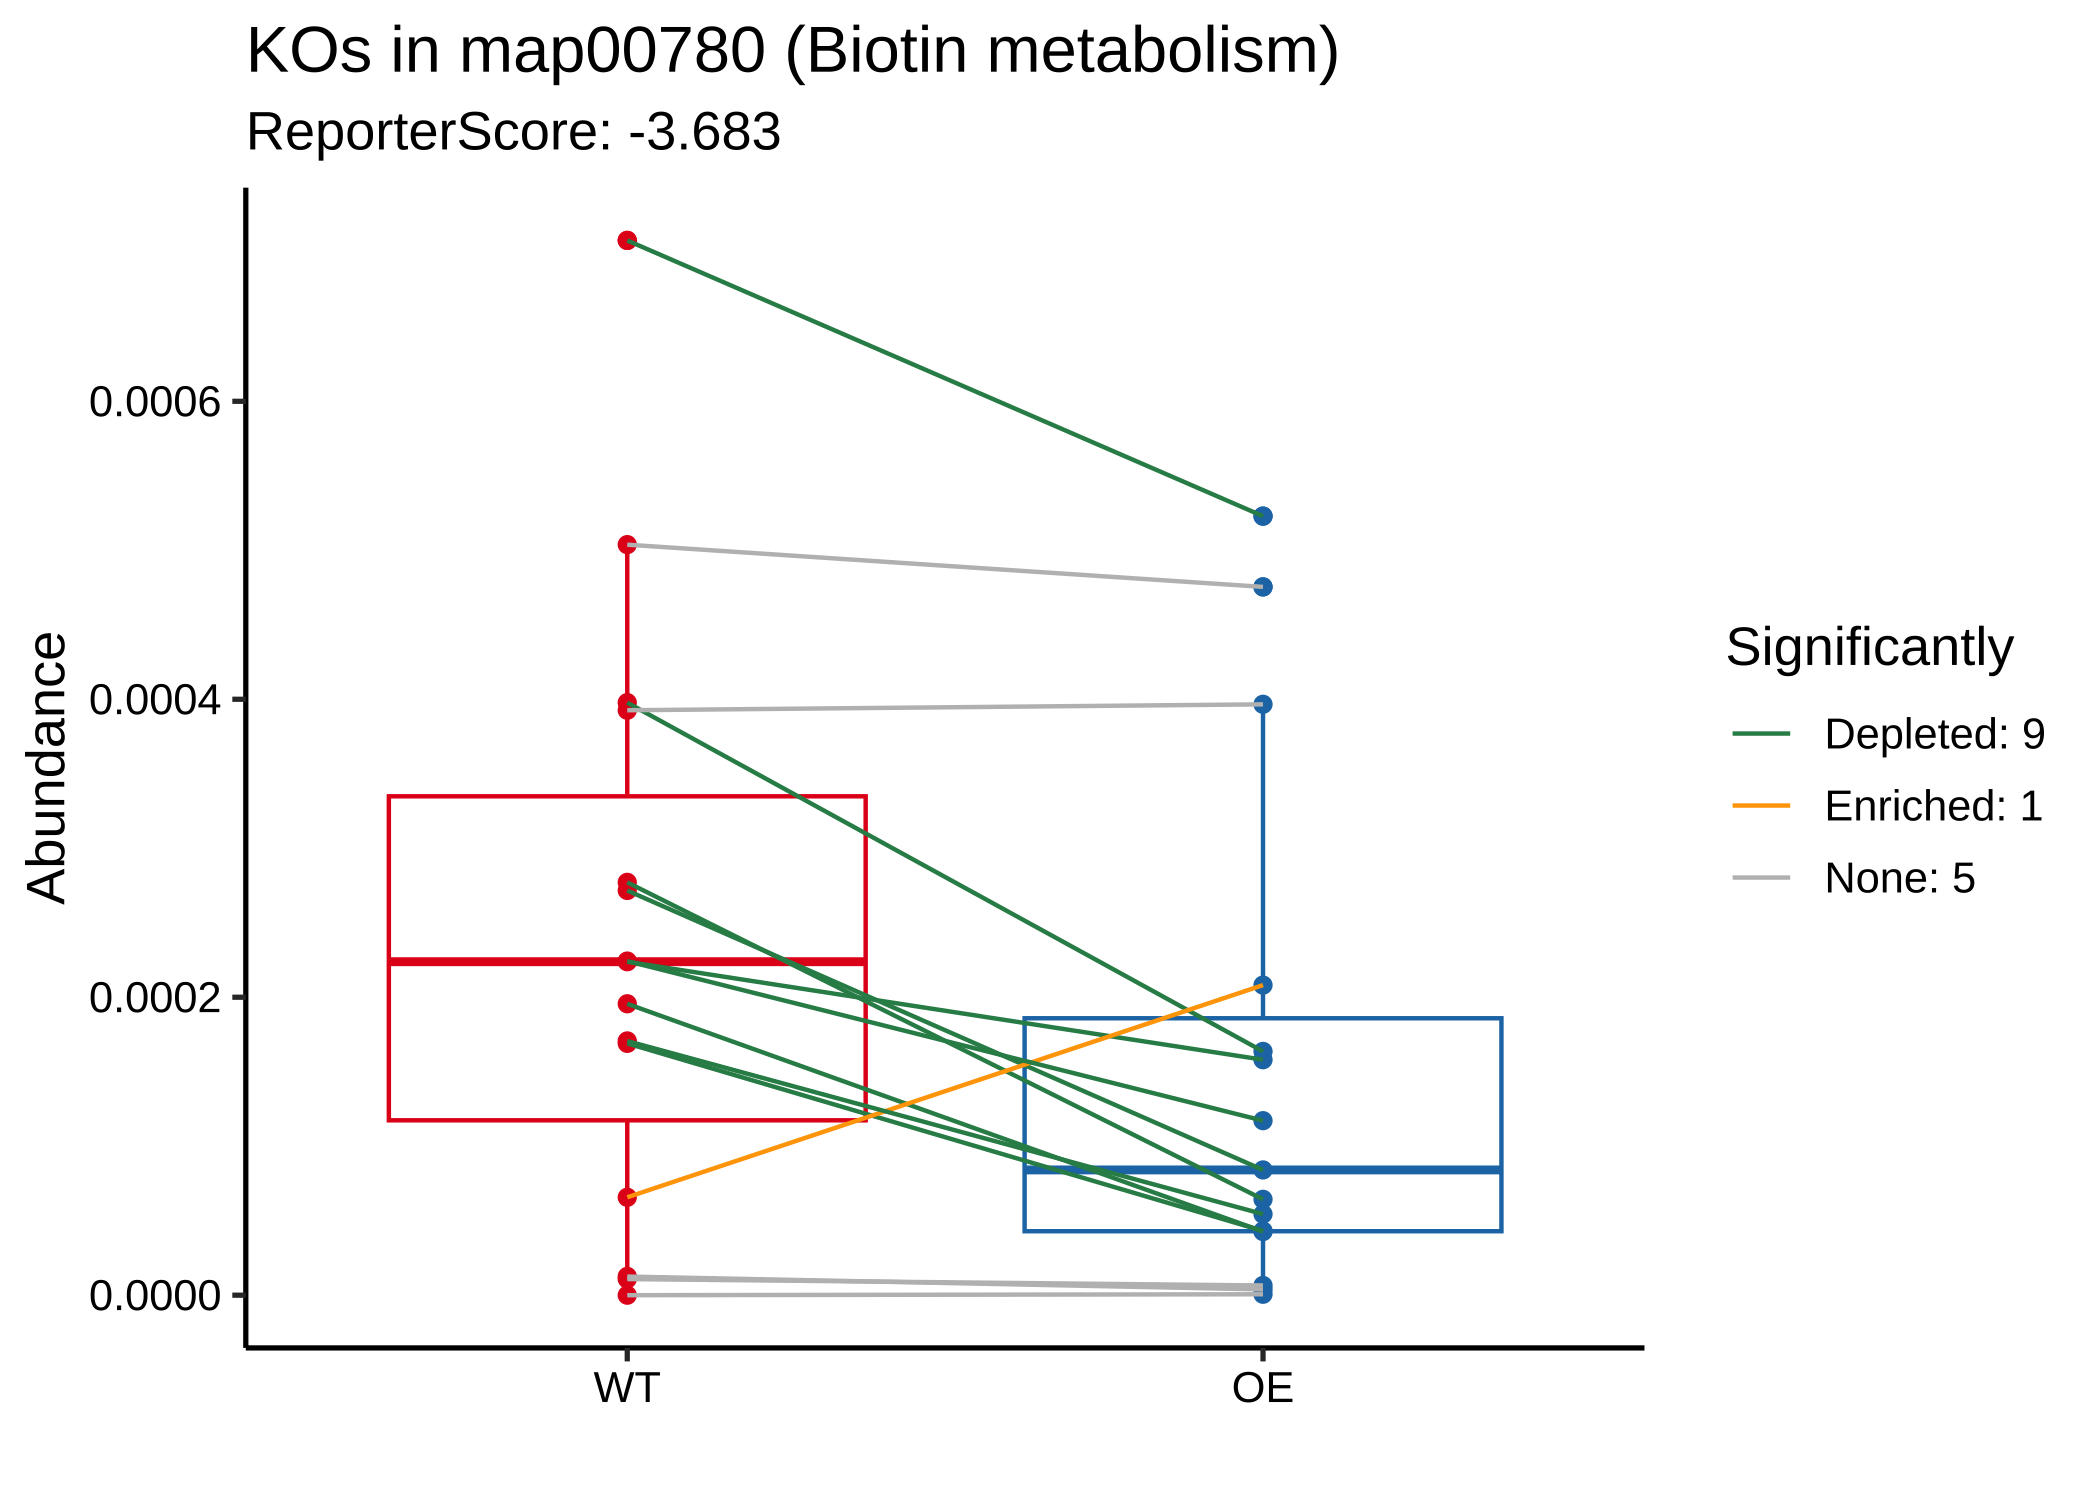
- 绘制Z分数的分布图:
plot_KOs_distribution(reporter_res, map_id = "map00780")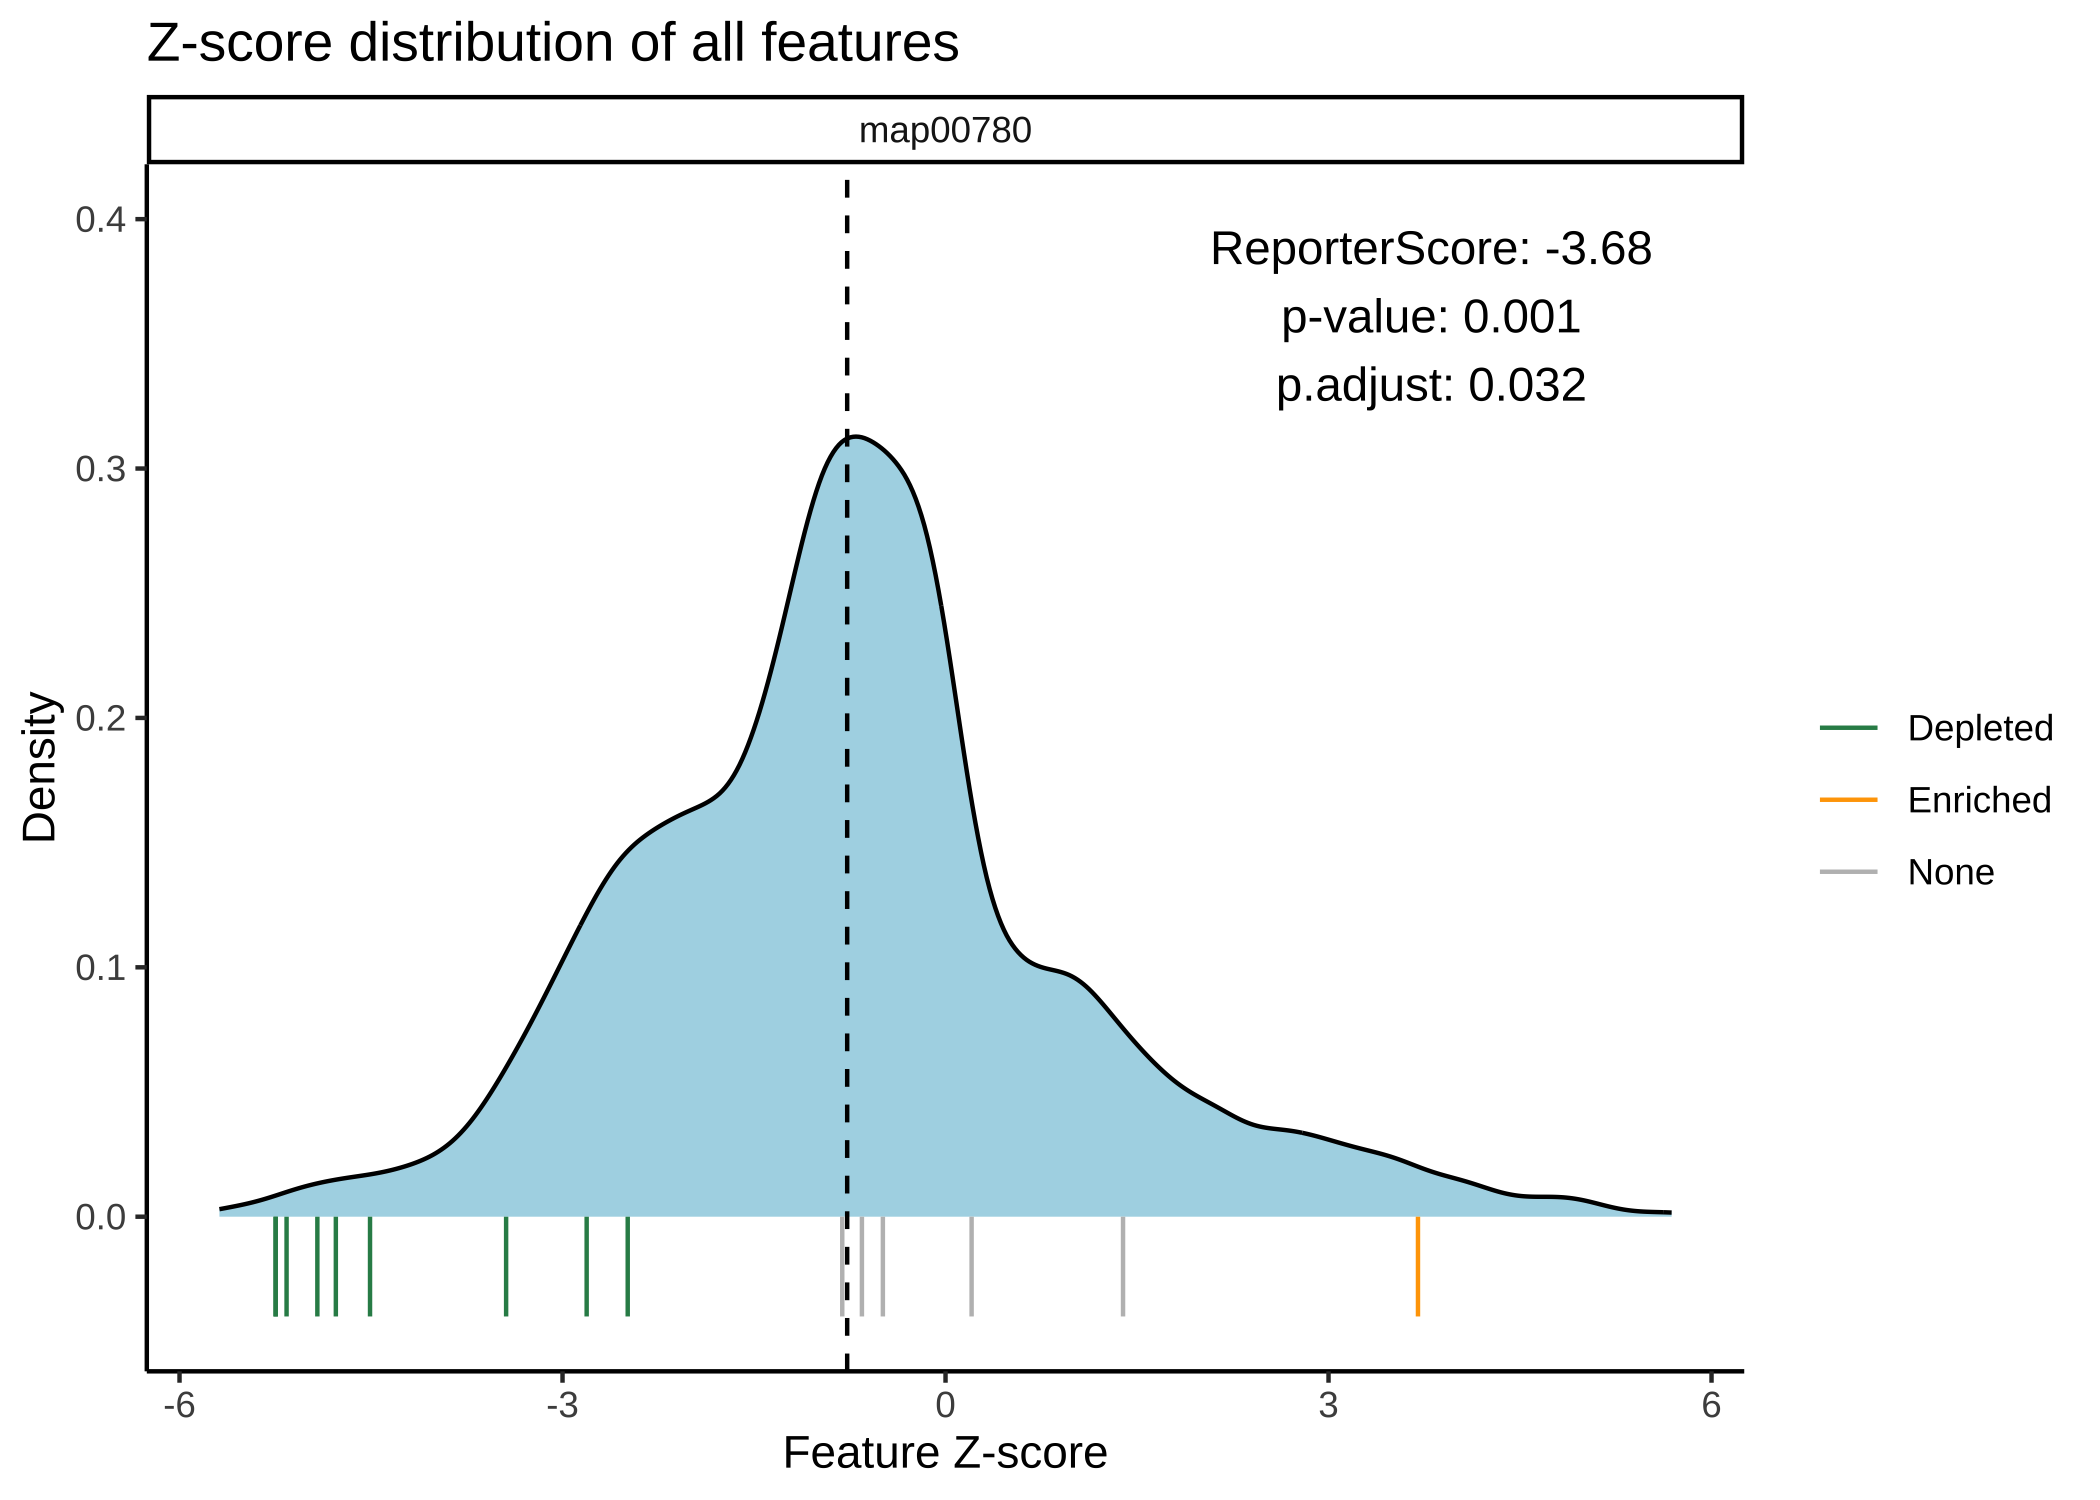
- 绘制网络图:
plot_KOs_network(reporter_res,
  map_id = c("map00780", "map00785", "map00900"),
  main = "", mark_module = TRUE
)
- 在通路中绘制KOs丰度:
plot_KOs_box(reporter_res, map_id = "map00780", only_sig = TRUE)
#> `geom_smooth()` using formula = 'y ~ x'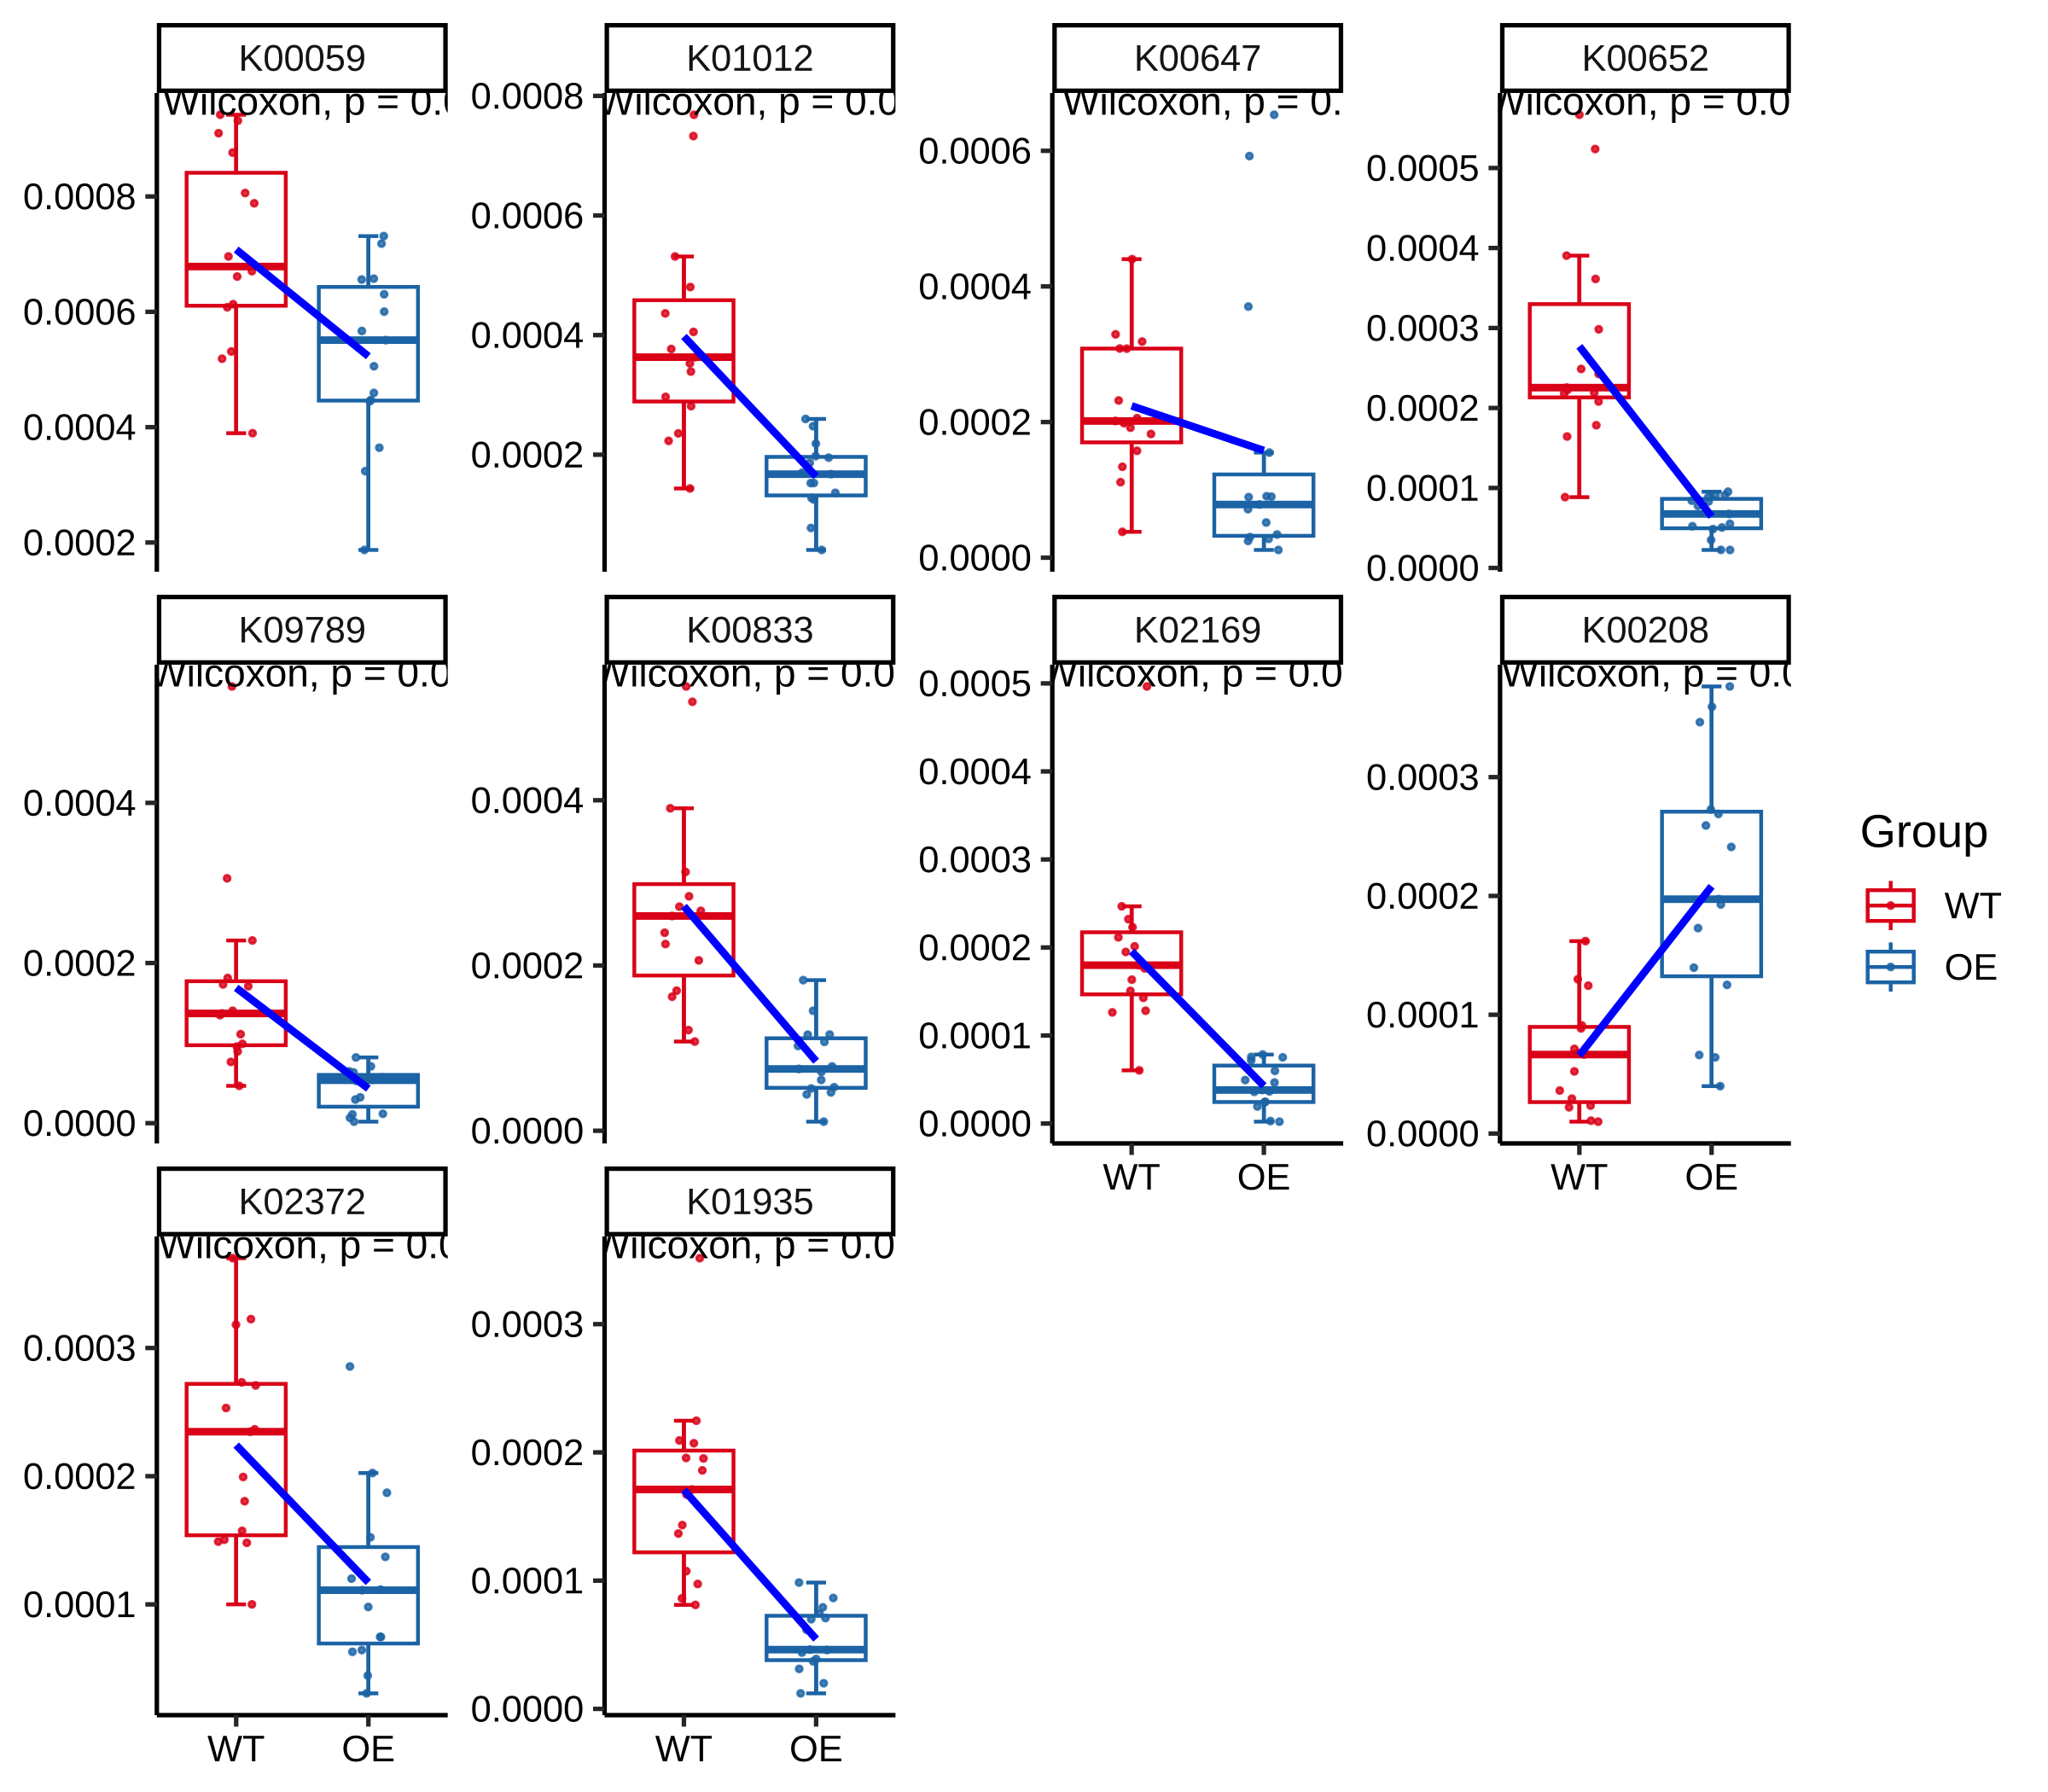
- 在通路中绘制KOs丰度(热图):
plot_KOs_heatmap(reporter_res,
  map_id = "map00780", only_sig = TRUE,
  heatmap_param = list(cutree_rows = 2)
)
- 绘制KEGG通路图:
plot_KEGG_map(reporter_res, map_id = "map00780", color_var = "Z_score")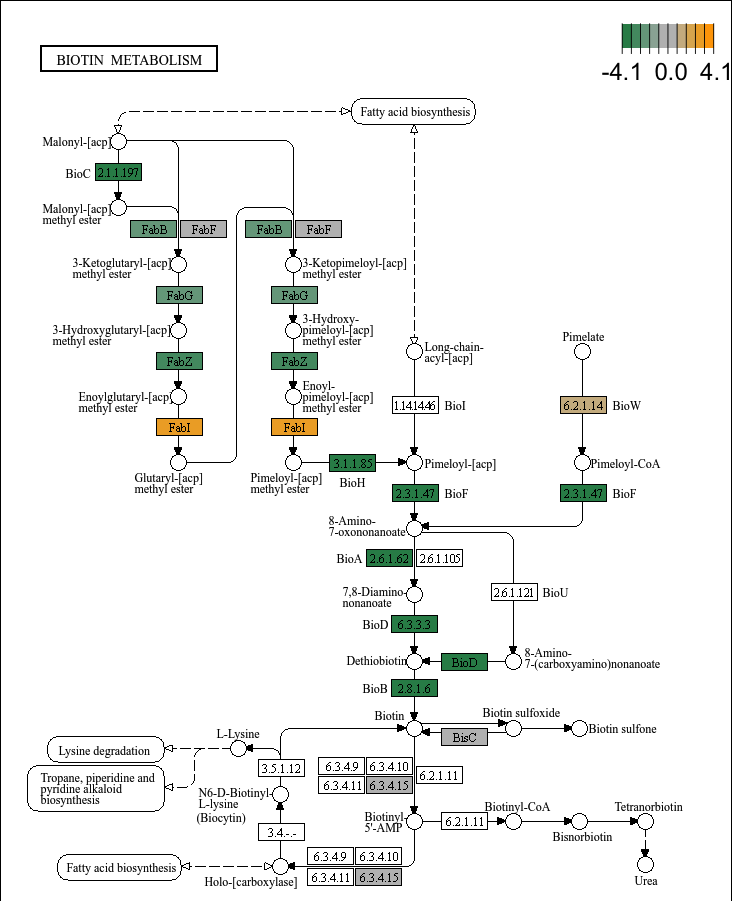
多组或纵向研究
如果我们的实验设计涉及多于两组或纵向研究,我们可以选择多组比较(或相关分析):
cat("Comparison: ", levels(factor(metadata$Group2)))
#> Comparison:  G1 G2 G3

reporter_res2 <- GRSA(KO_abundance, "Group2", metadata,
  mode = "directed",
  method = "spearman", perm = 999
)
#> ================================Use feature: ko=================================
#> ===============================Checking rownames================================
#> Some of your ko_stat are not KO id, check the format! (e.g. K00001)
#> 52.7% of your kos in the modulelist!
#> 30 samples are matched for next step.
#> ===========================Removing all-zero rows: 0============================
#> ===================================1.KO test====================================
#> =================================Checking group=================================
#> 30 samples are matched for next step.
#> ===========================Removing all-zero rows: 0============================
#> ==============================Calculating each KO===============================
#> =============================Using method: spearman=============================
#> Using correlation analysis: spearman, the groups will be transform to numeric, note the factor feature of group.
#> 1000 features done.
#> 2000 features done.
#> 3000 features done.
#> 4000 features done.
#>
#> Compared groups: G1, G2, G3
#> Total KO number: 4535
#> Compare method: spearman
#> Time use: 0.549
#> =========================2.Transfer p.value to Z-score==========================
#> ==========================3.Calculating reporter score==========================
#> ==================================load KOlist===================================
#> ===================KOlist download time: 2023-08-14 16:00:52====================
#> If you want to update KOlist, use `update_KO_file()`
#> ============================Calculating each pathway============================
#> 100 pathways done.
#> 400 pathways done.
#> ID number: 481
#> Time use: 1.643
#> ====================================All done====================================

plot_KOs_in_pathway(reporter_res2, map_id = "map02060") + scale_y_log10()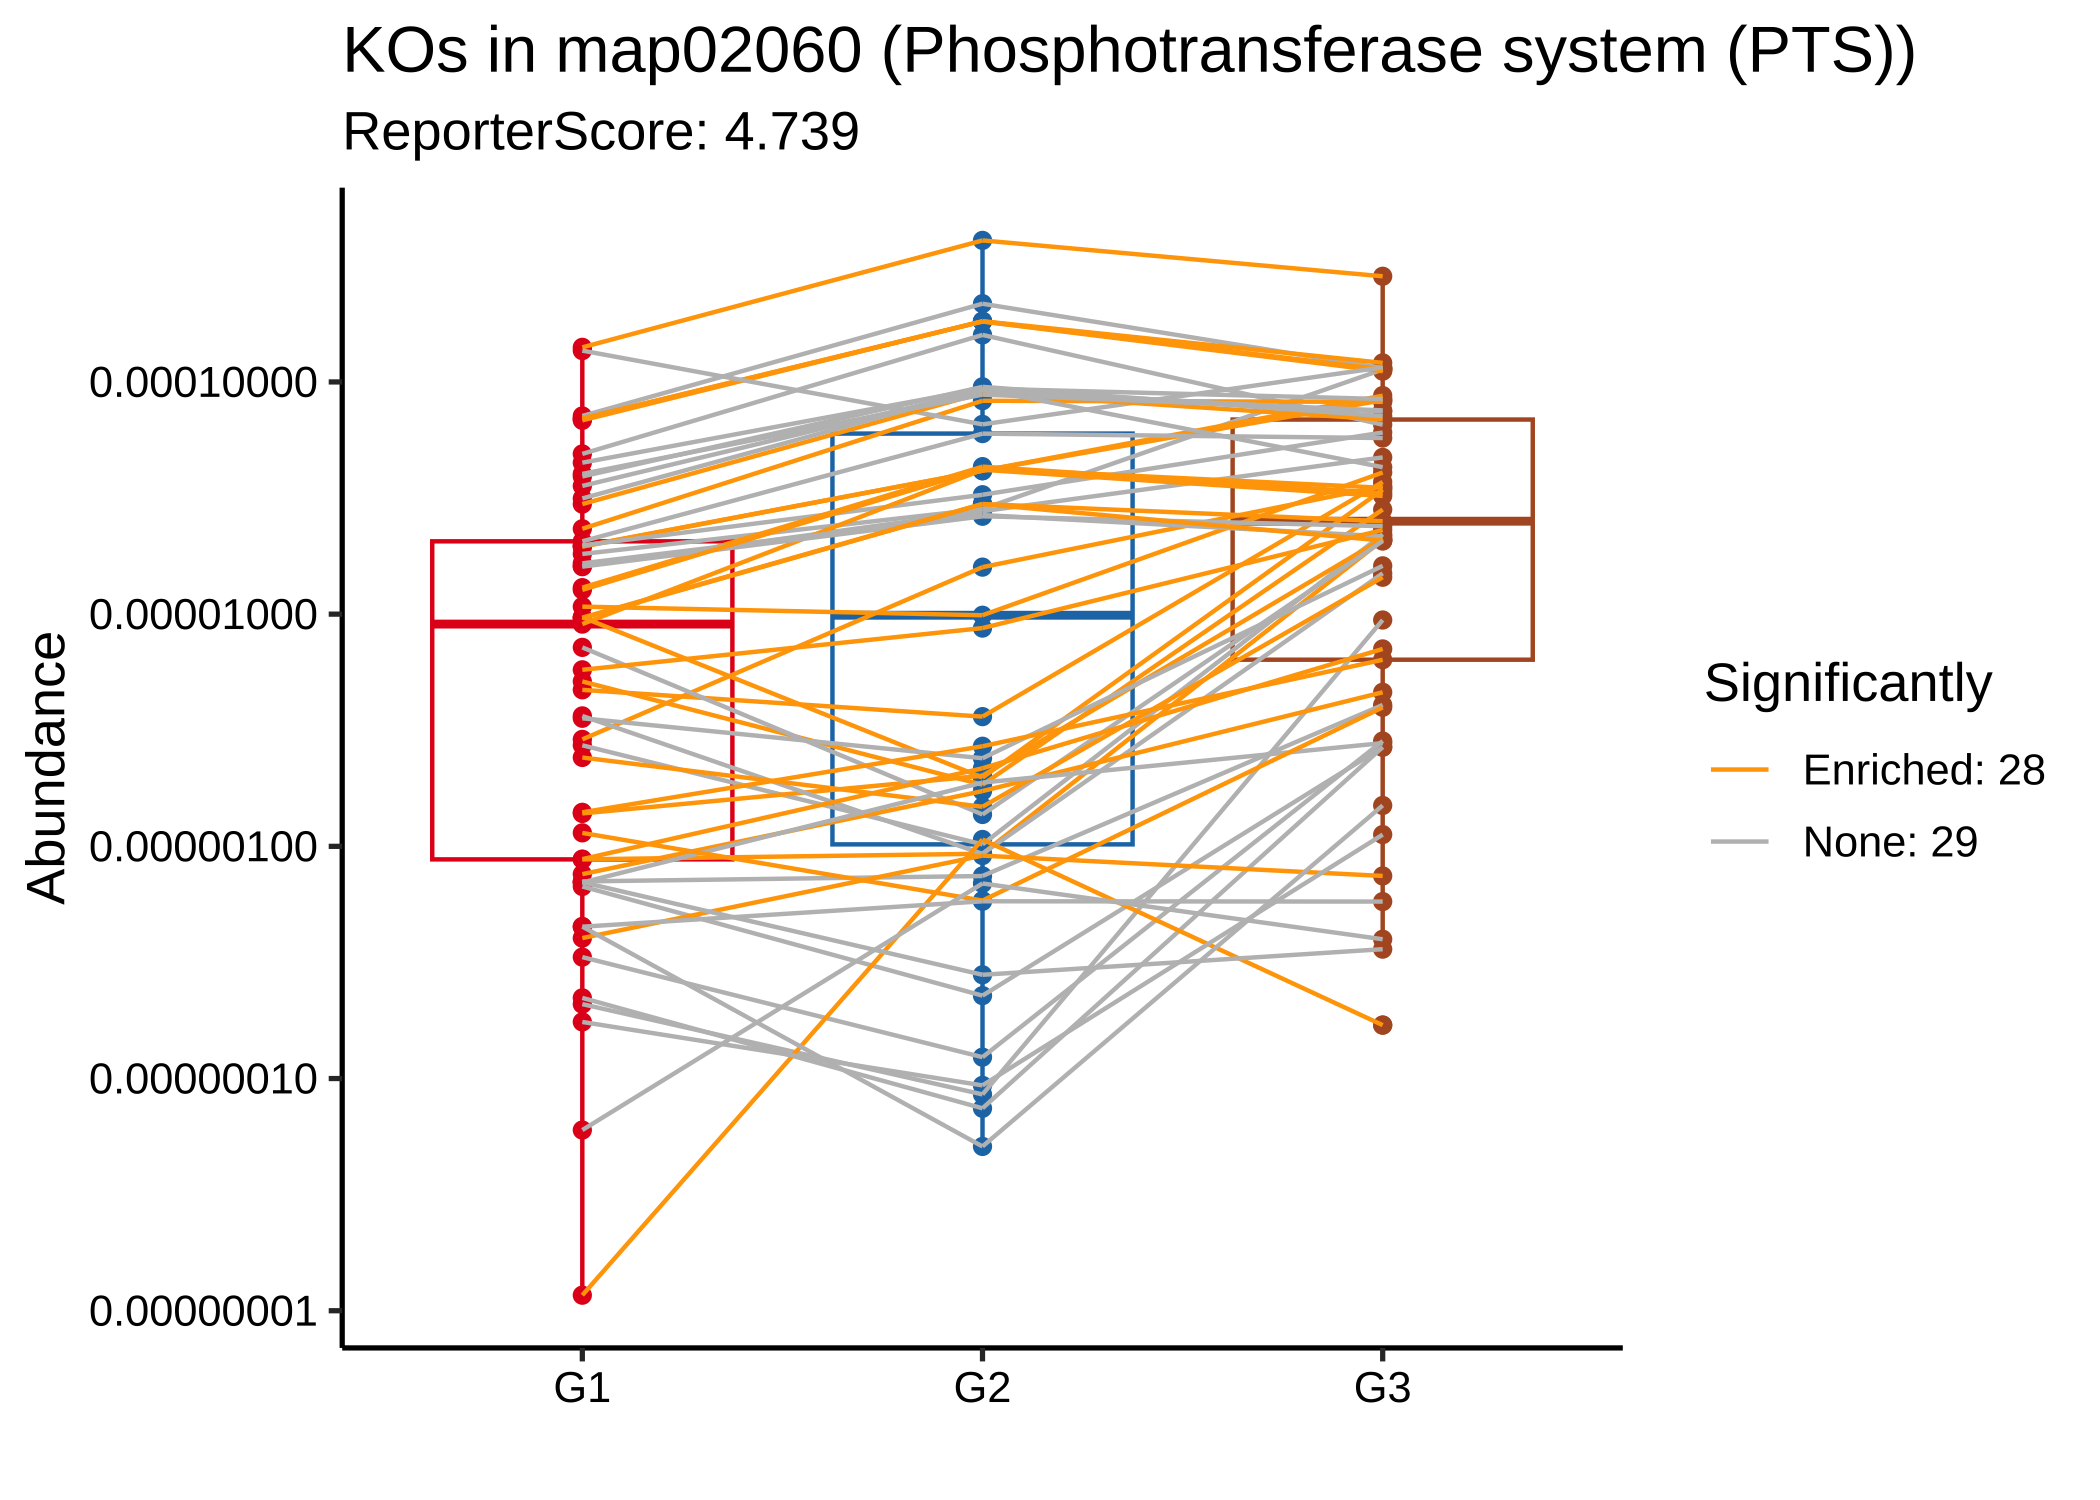
指定pattern
例如,如果我们期望出现指数增长趋势,可以将组别 “G1”,“G2” 和 “G3” 设置为 1、10 和 100。
我们使用 1、5、1 来寻找表现为下降-上升-下降模式的通路。
reporter_res3 <- GRSA(KO_abundance, "Group2", metadata,
  mode = "directed", perm = 999,
  method = "pearson", pattern = c("G1" = 1, "G2" = 5, "G3" = 1)
)
plot_report_bar(reporter_res3, rs_threshold = 3, show_ID = TRUE)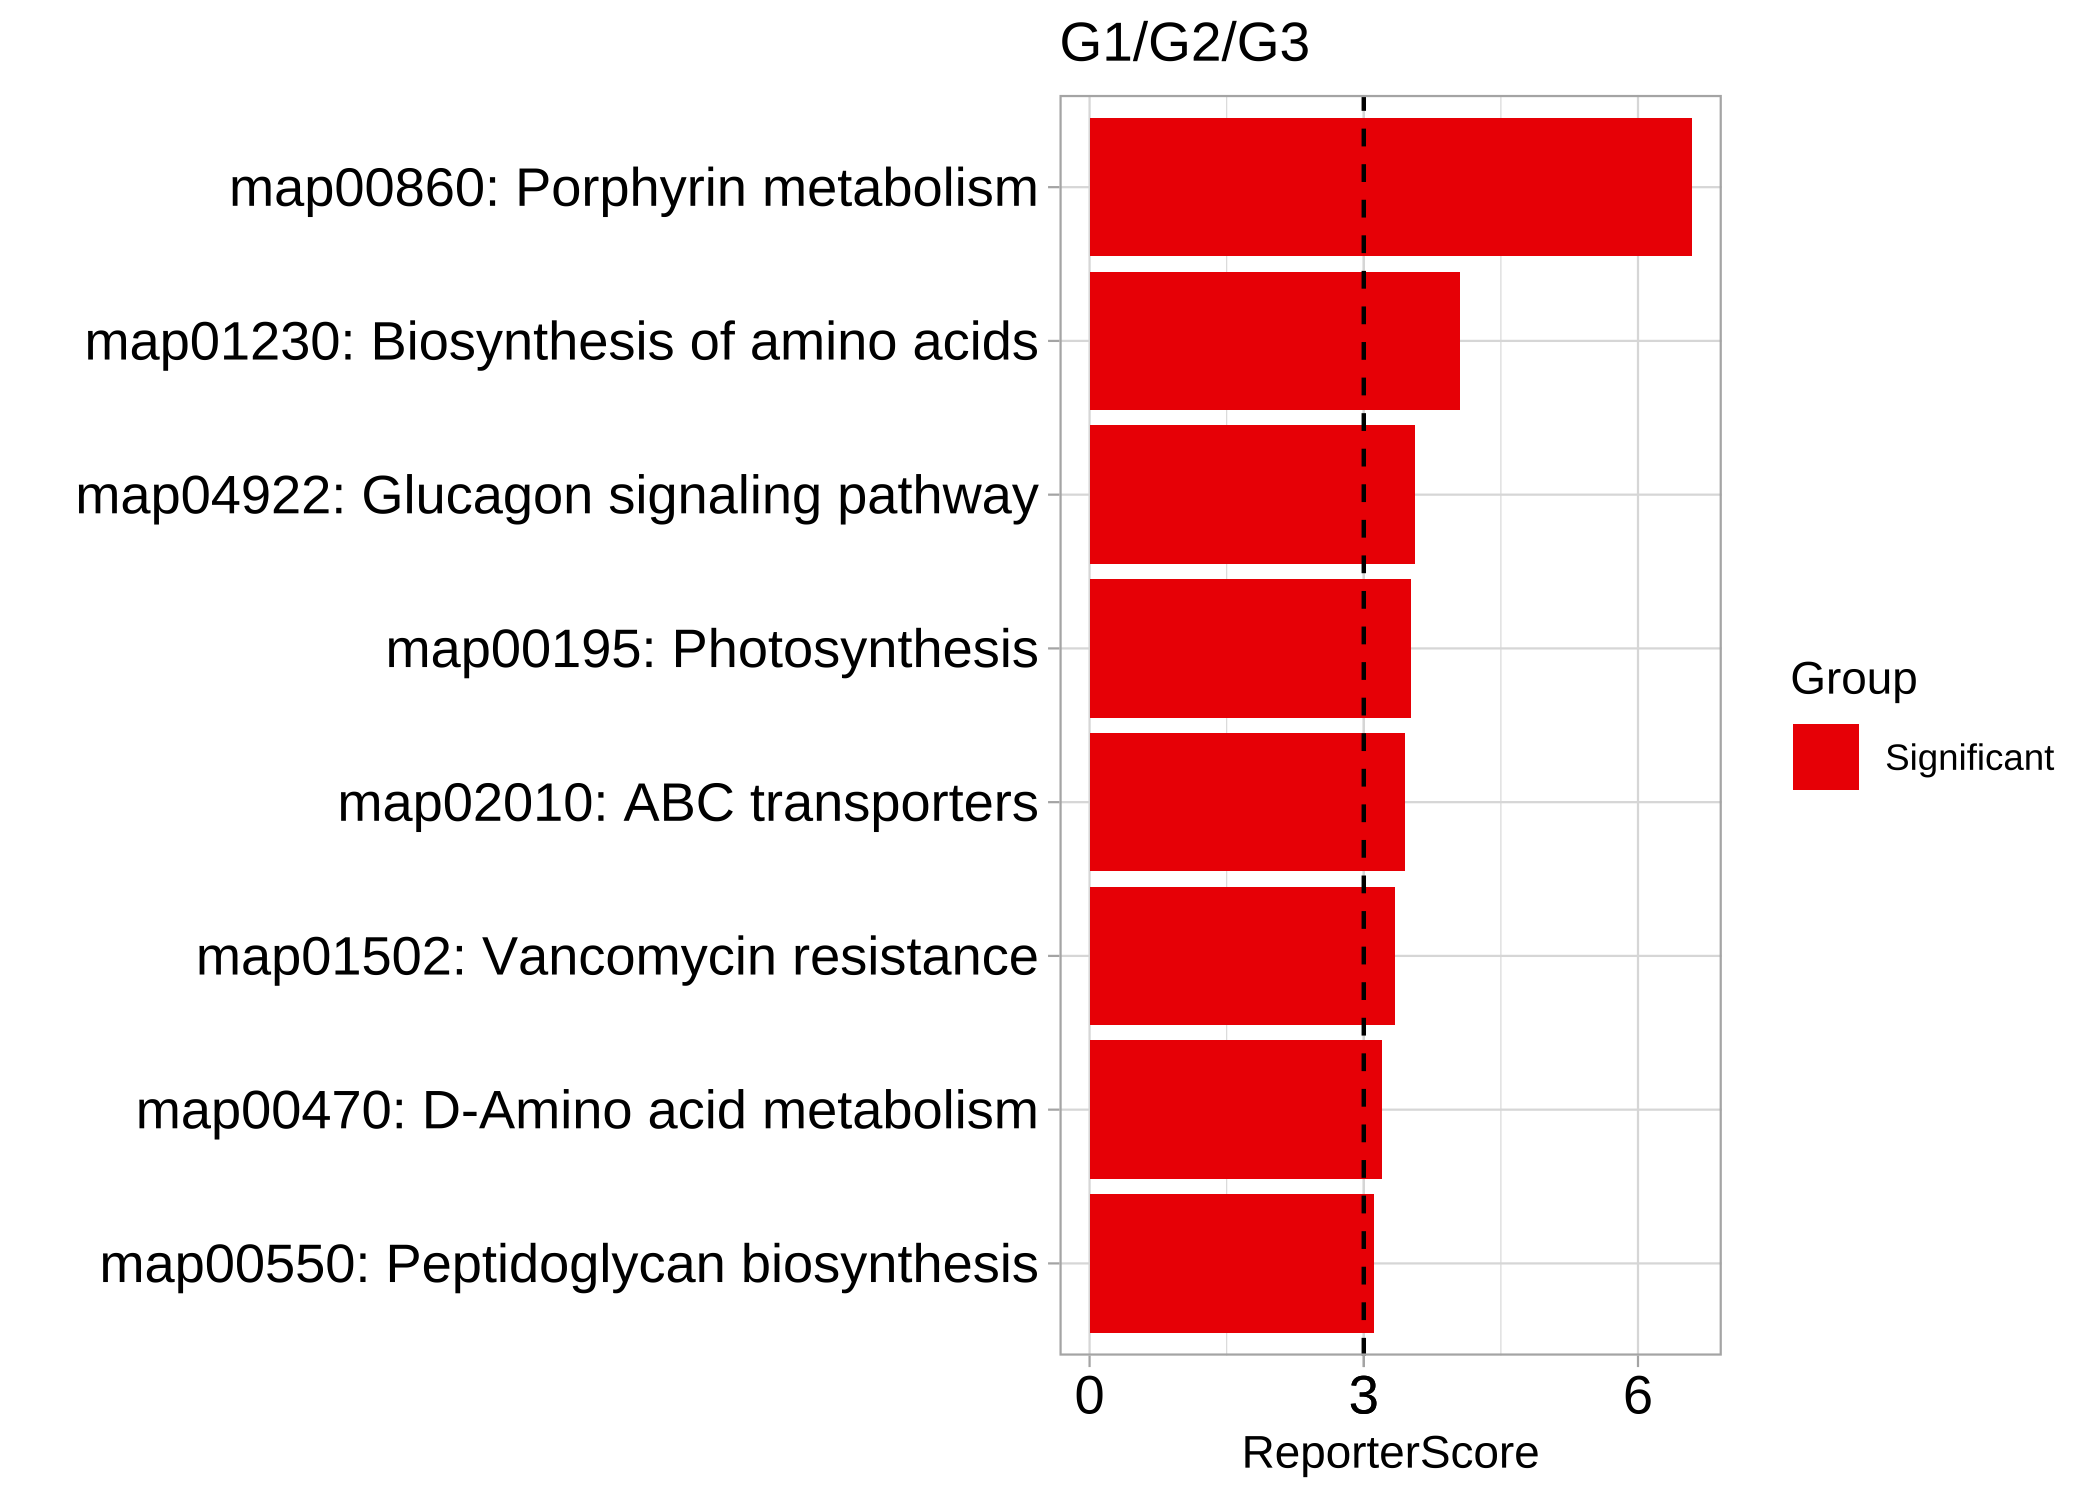
plot_KOs_in_pathway(reporter_res3, map_id = "map00860")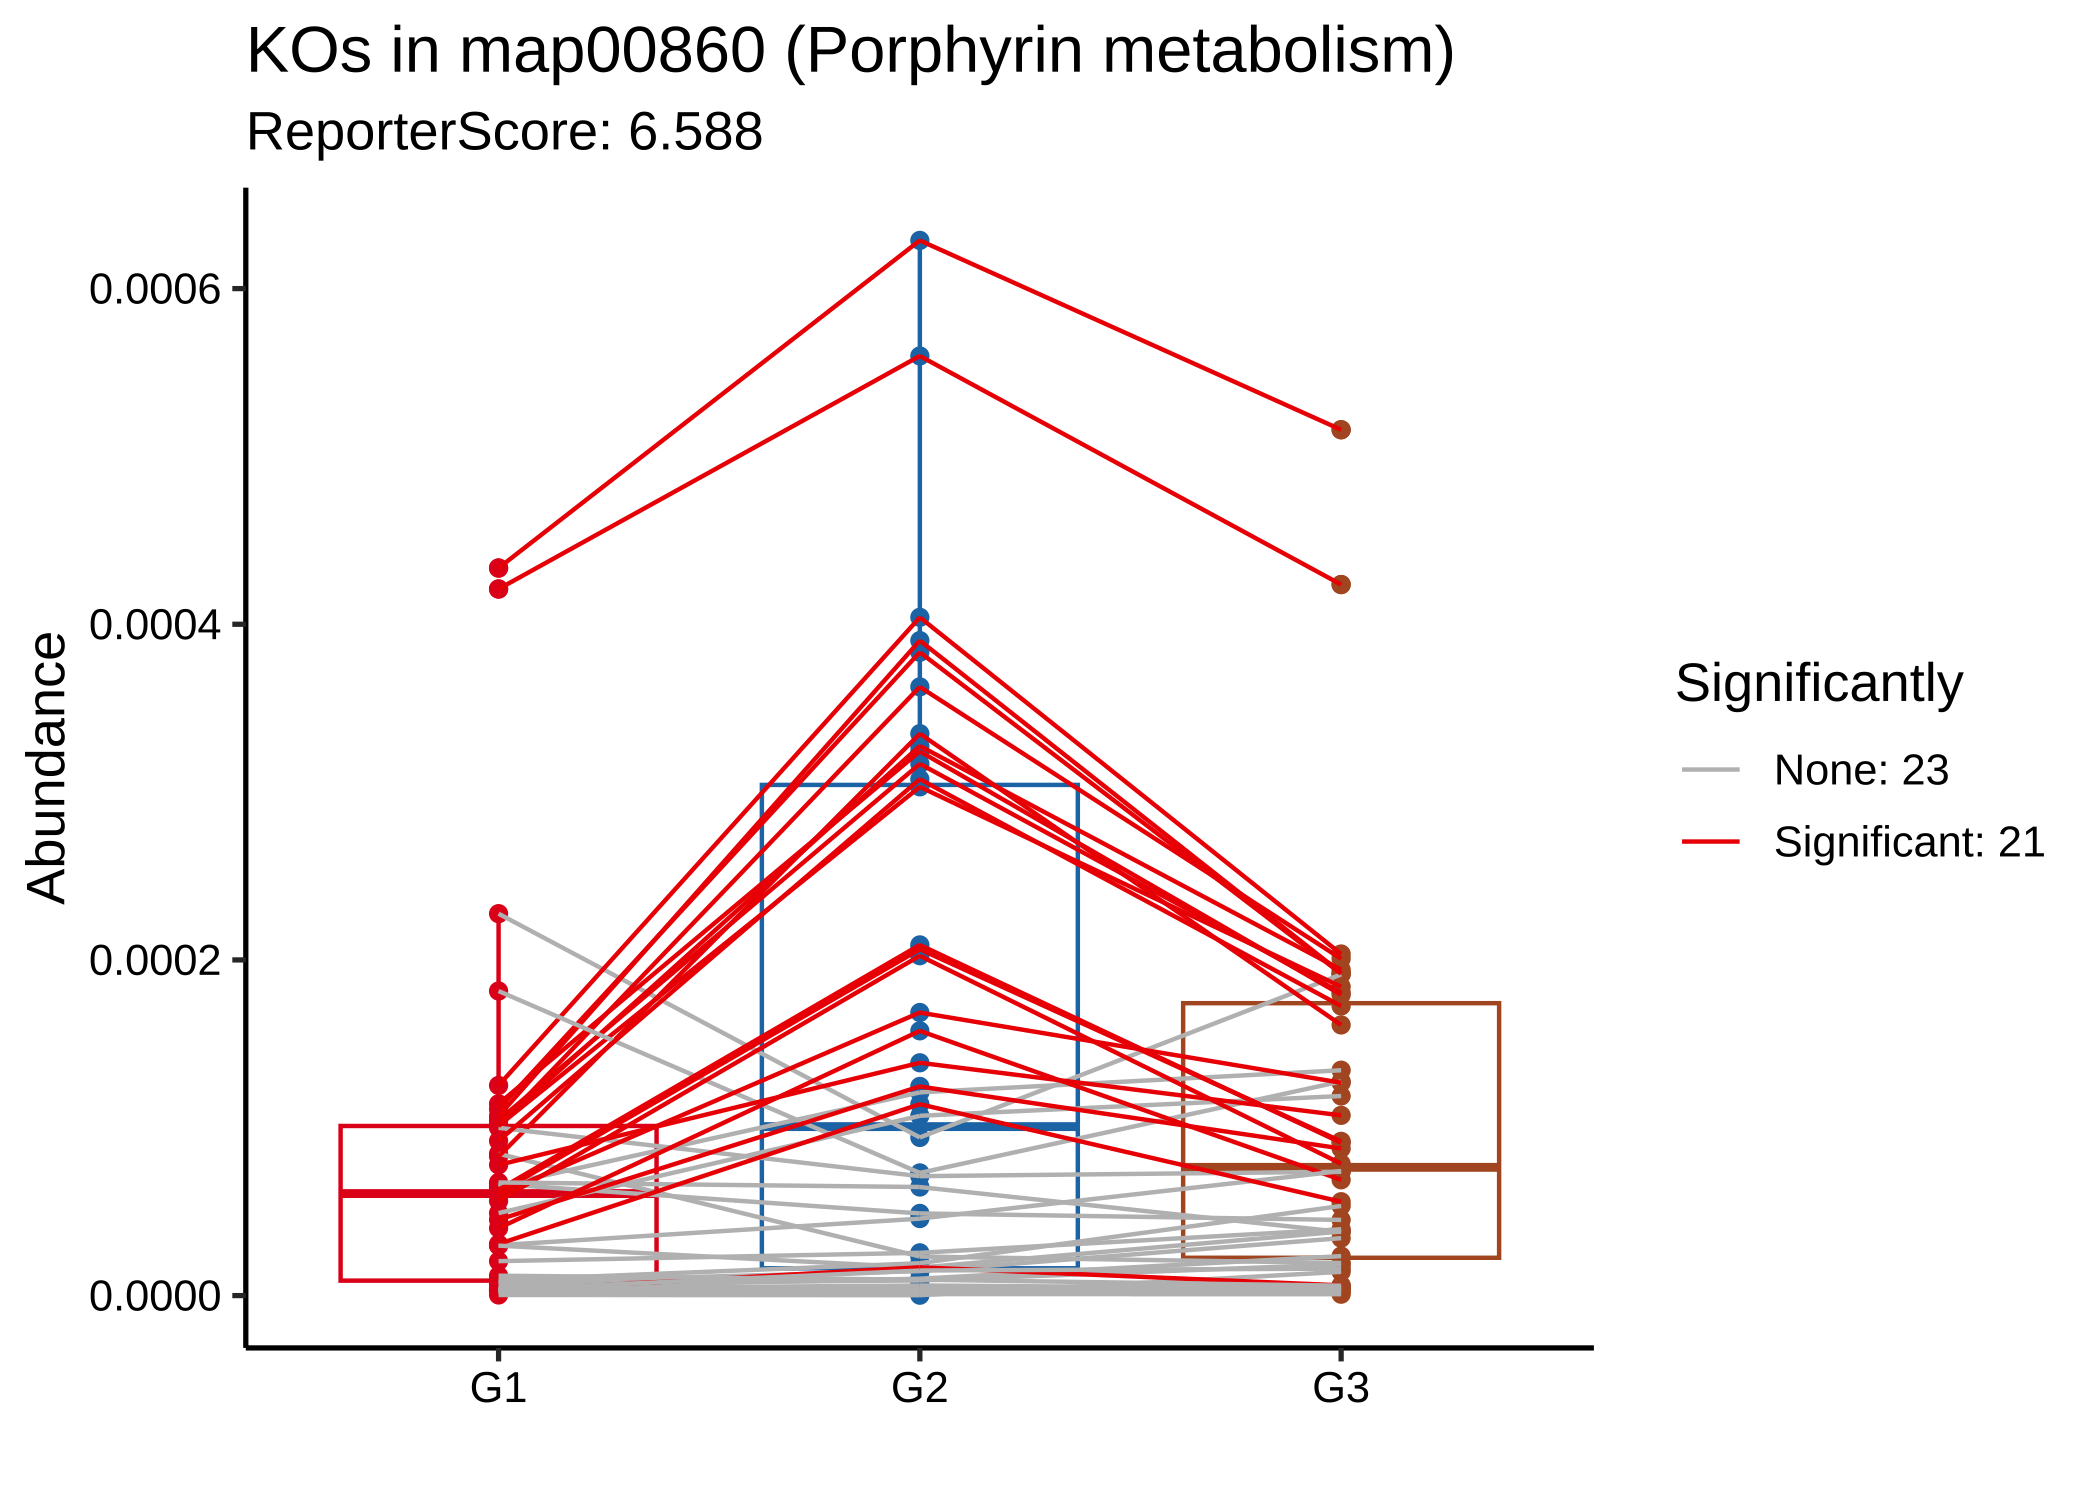
为了探索数据中的潜在patterns,使用聚类方法,如C均值聚类。
rsa_cm_res <- RSA_by_cm(KO_abundance, "Group2", metadata,
  method = "pearson",
  k_num = 3, perm = 999
)
# show the patterns
plot_c_means(rsa_cm_res, filter_membership = 0.7)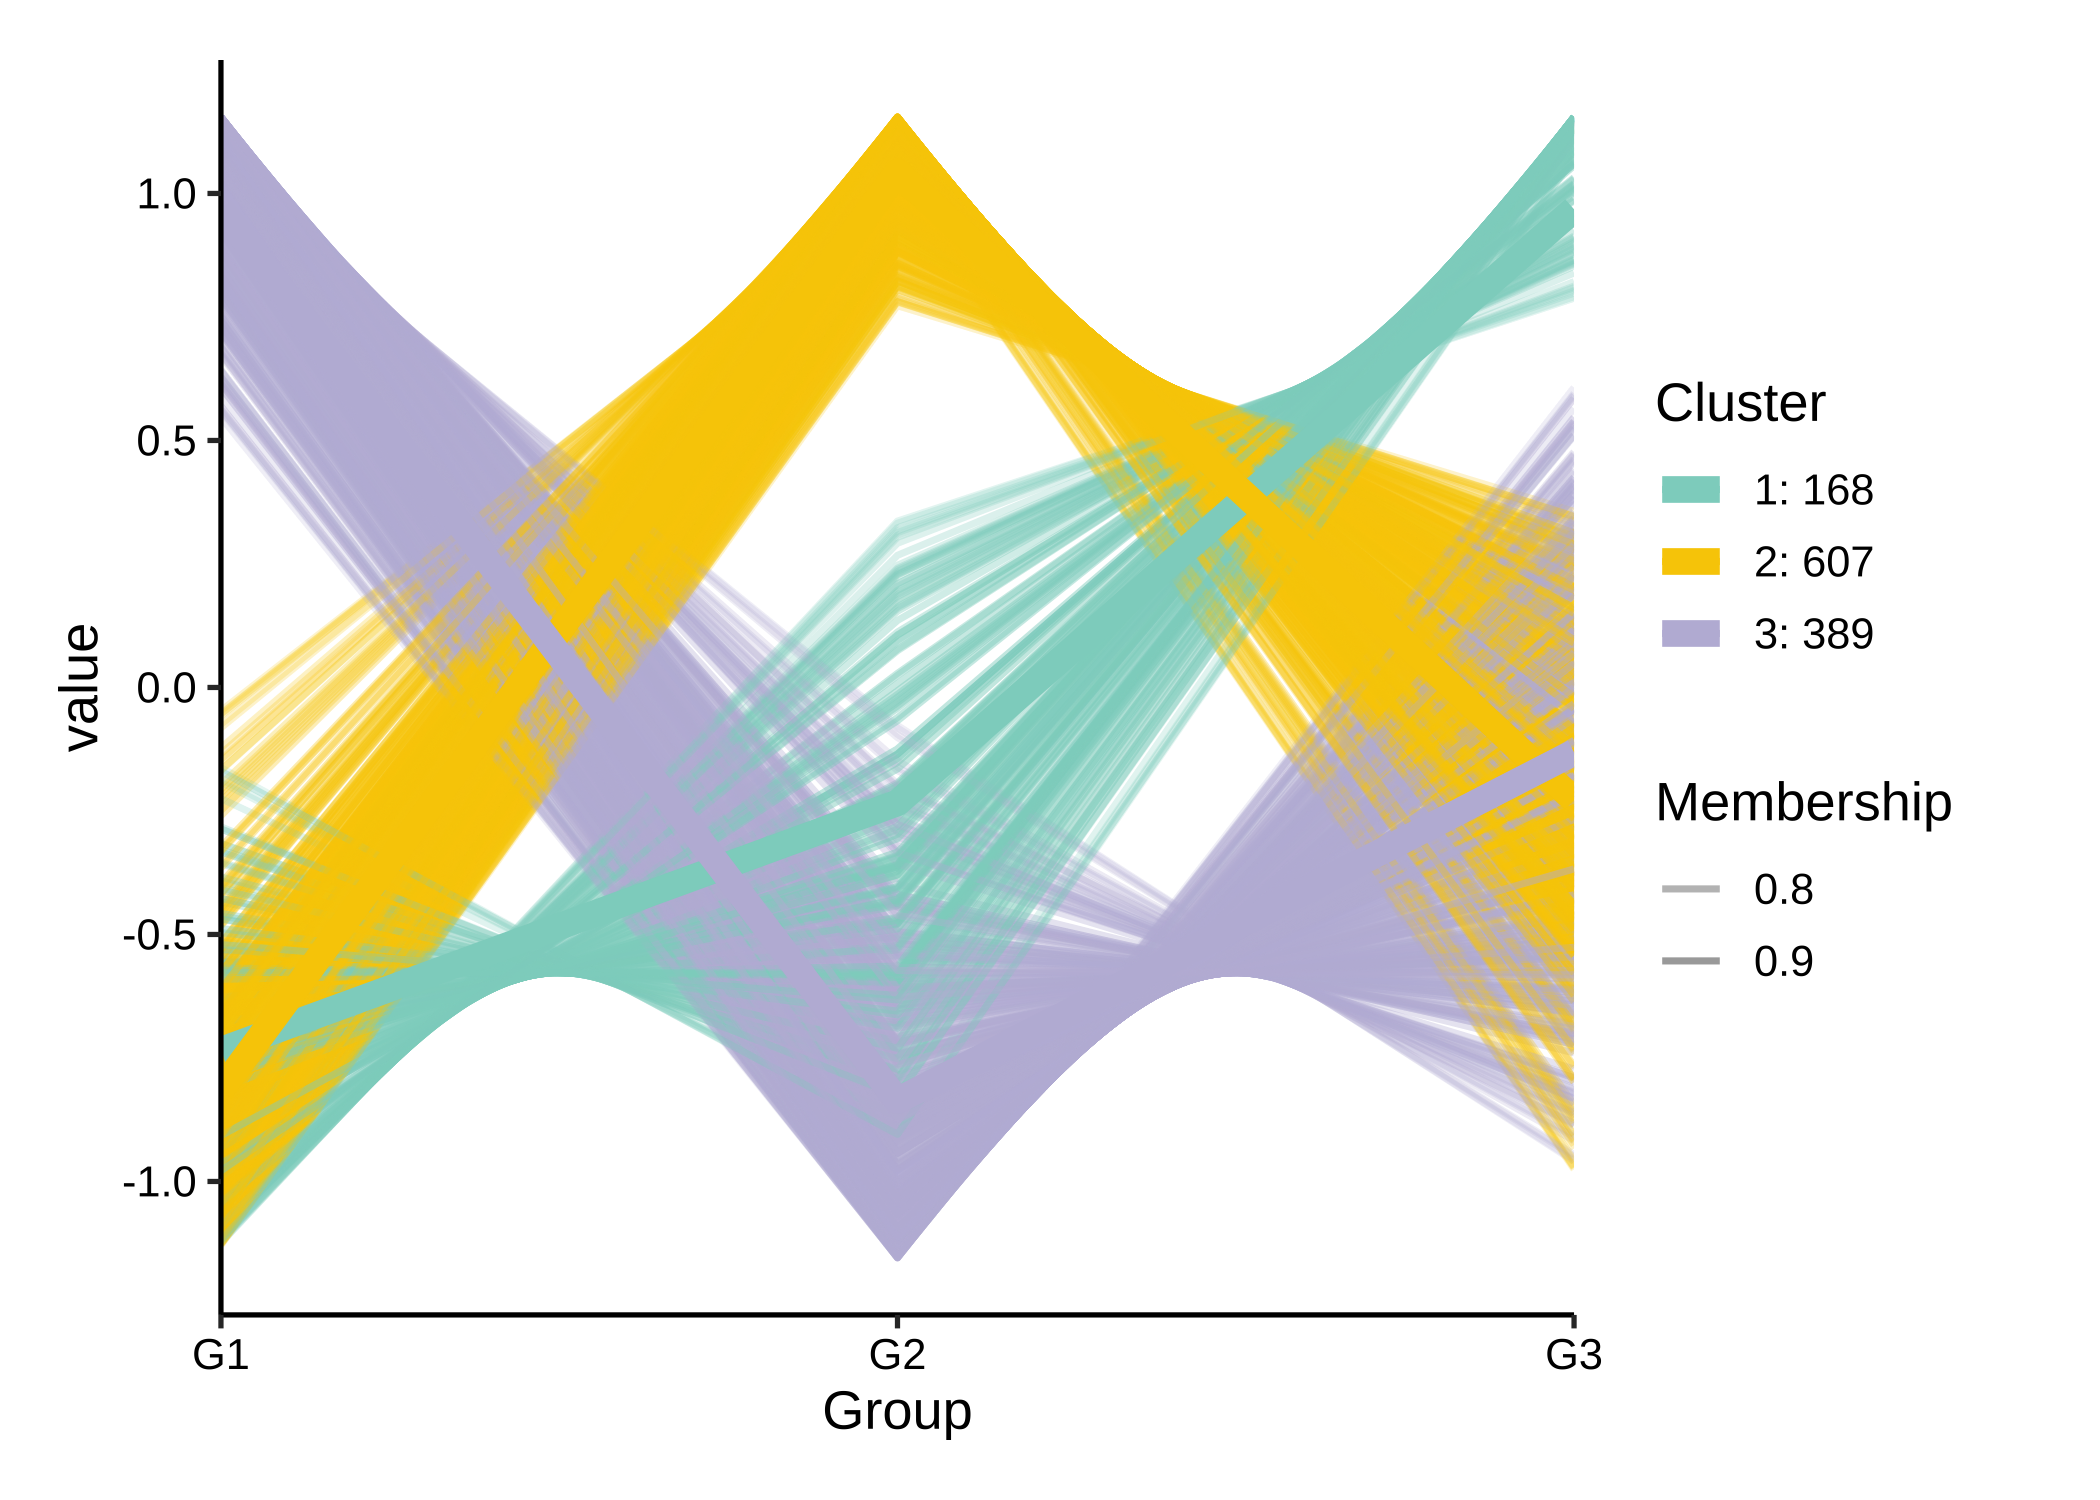
plot_report_bar(rsa_cm_res, rs_threshold = 2.5, y_text_size = 10)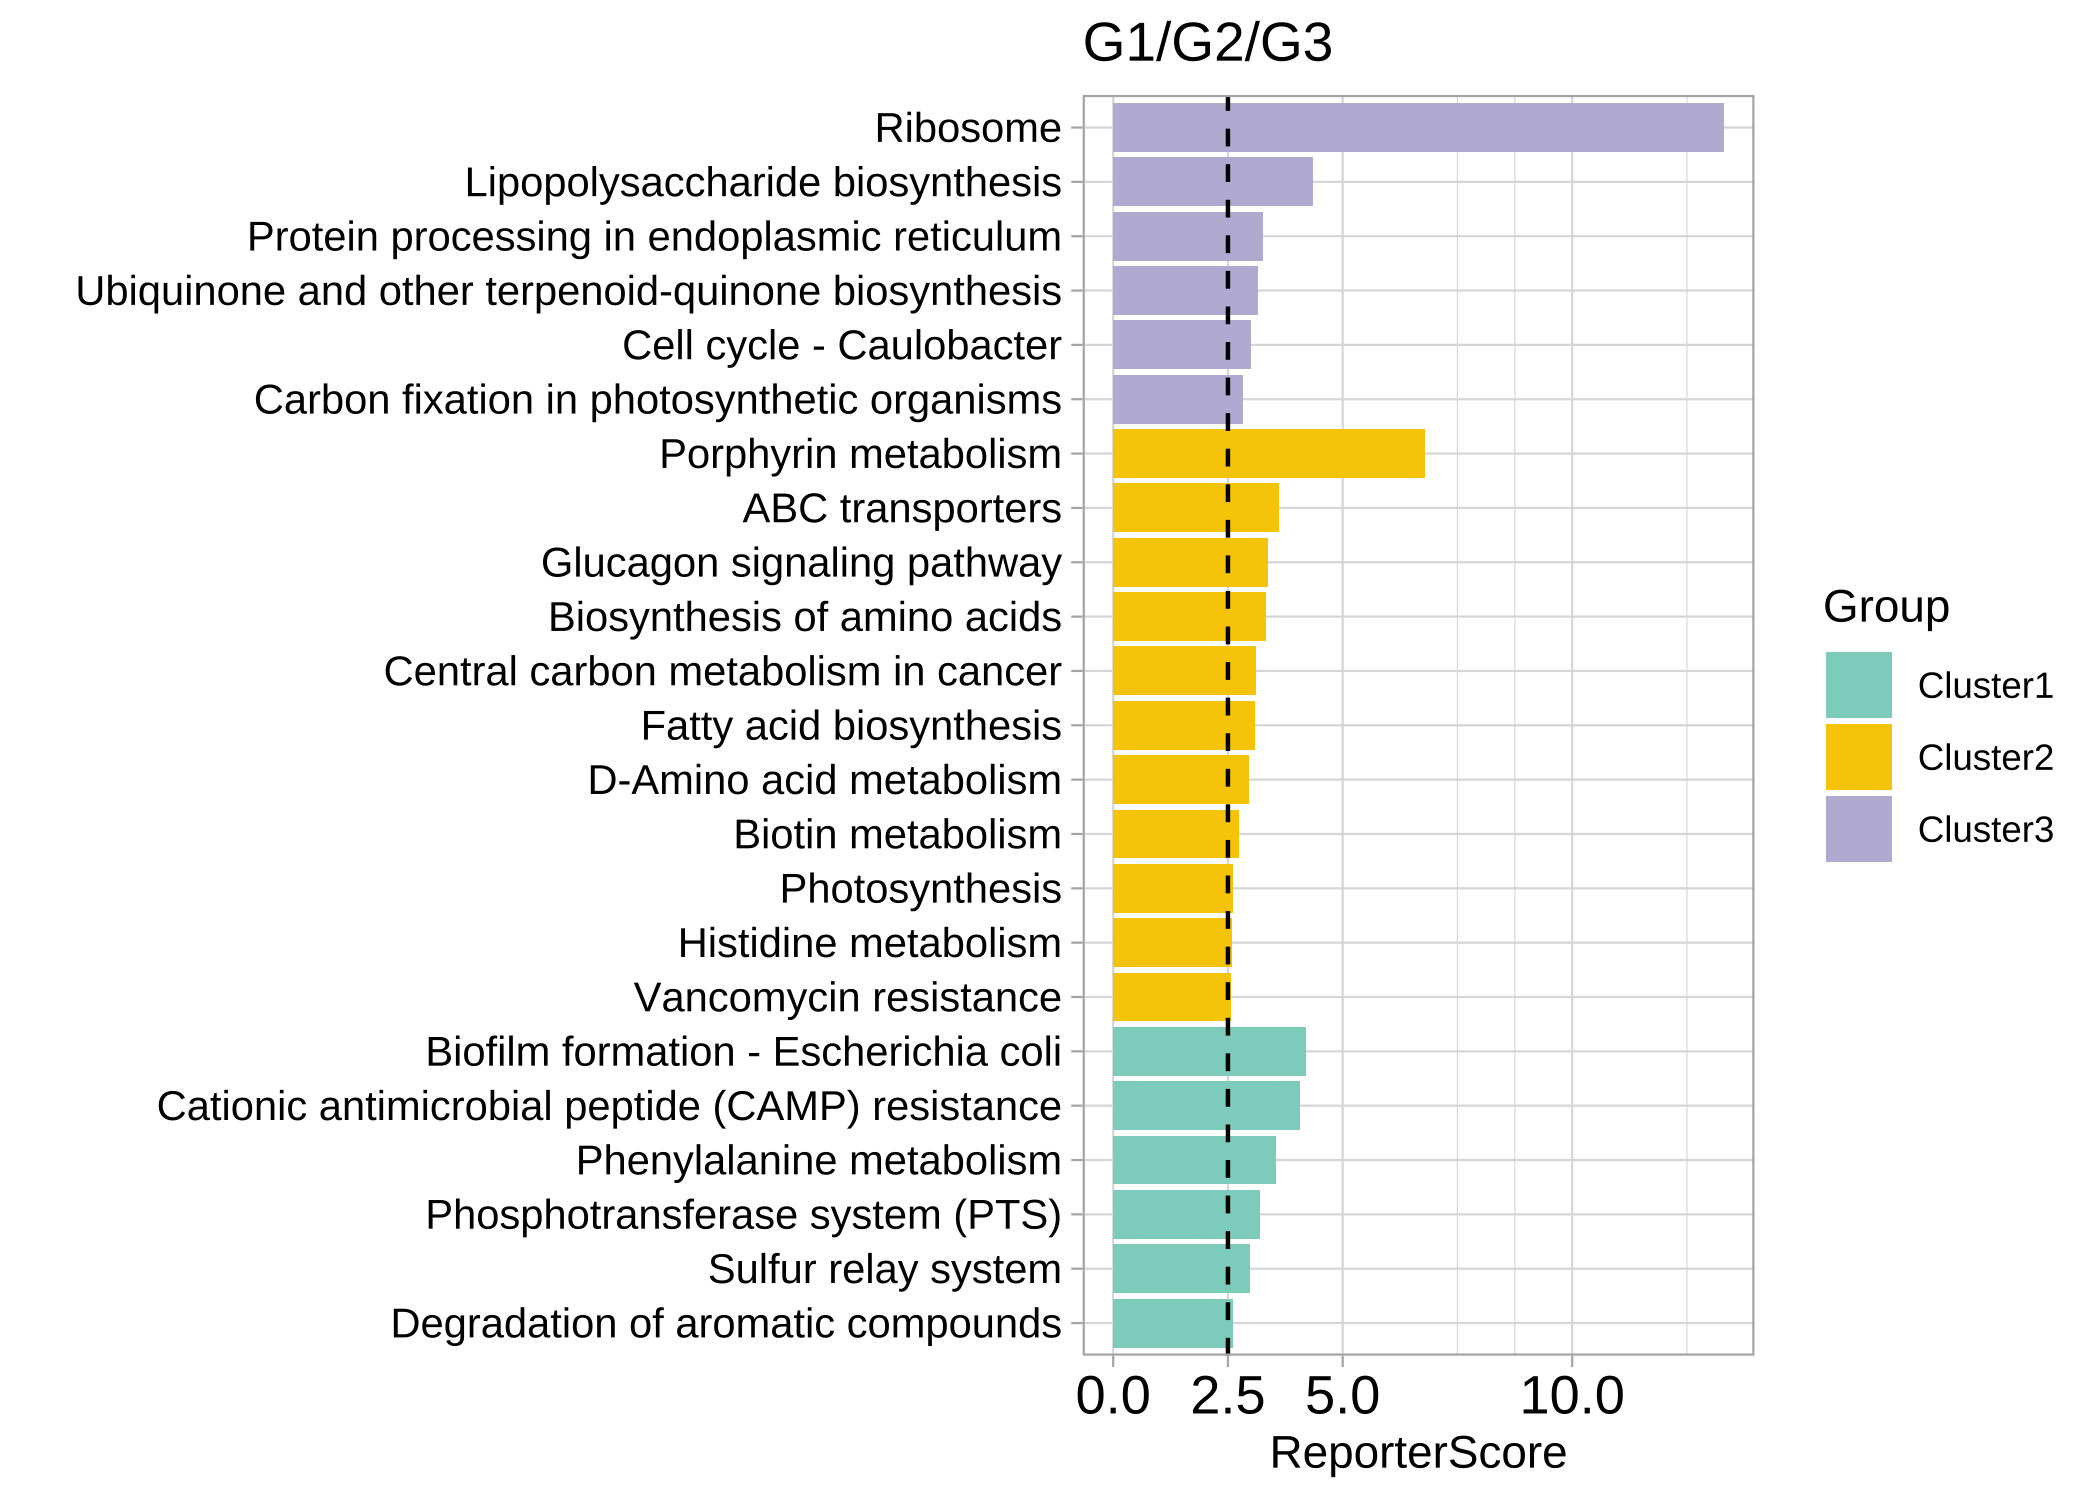
详细信息
逐步说明
单步函数 reporter_score/GRSA 包含三个部分:
data("KO_abundance_test")
ko_pvalue <- ko.test(KO_abundance, "Group", metadata, method = "wilcox.test")
ko_stat <- pvalue2zs(ko_pvalue, mode = "directed")
reporter_s1 <- get_reporter_score(ko_stat, perm = 499)ko.test: 此函数用于计算 KO_abundance 的 p-value,可使用各种内置方法,如差异分析 (t.test,wilcox.test,kruskal.test,anova) 或相关分析 (pearson,spearman,kendall)。您也可以使用其他方法计算 KO_abundance 的 p-value,比如 “DESeq2”, “Edger”, “Limma”, “ALDEX”, “ANCOM”,并自行进行 p.adjust,然后跳过ko.test步骤,继续下一步……pvalue2zs: 此函数将 KOs 的 p-value 转换为 Z 分数(选择模式: “mixed” 或 “directed”)。get_reporter_score: 此函数在特定数据库中计算每个通路的Reporter Score。您可以在此处使用自定义数据库。
以 “Limma” 为例:
# 1-1. 使用 Limma 计算 p-value
ko_pvalue <- ko.test(KO_abundance, "Group", metadata, method = "none")

ko_Limma_p <- pctax::diff_da(KO_abundance, group_df = metadata["Group"], method = "limma")

# 1-2. 替换 ko_pvalue 中的 p-value,记得匹配 KO_ids
ko_pvalue$`p.value` <- ko_Limma_p[match(ko_pvalue$KO_id, ko_Limma_p$tax), "pvalue"]

# 2. 使用 `pvalue2zs` 获取 Z 分数
ko_stat <- pvalue2zs(ko_pvalue, mode = "directed")

# 3. 使用 `get_reporter_score` 获取Reporter Score
reporter_s1 <- get_reporter_score(ko_stat, perm = 499)

# 4. 组合结果
reporter_res1 <- combine_rs_res(KO_abundance, "Group", metadata, ko_stat, reporter_s1)

# 然后可以使用 reporter_res1 进行可视化
其他常用的富集方法
| Category | Method | Tools | Notes |
|---|---|---|---|
| ORA | Hypergeometric test / Fisher’s exact test | DAVID (website) , clusterProfiler (R package) | The most common methods used in enrichment analysis. Selecting a list of genes is required. |
| FCS | Gene set enrichment analysis (GSEA) | GSEA (website) | GSEA creatively uses gene ranking, rather than selecting a list of genes, to identify statistically significant and concordant differences across gene sets. |
| FCS | Generalized reporter score-based analysis (GRSA/RSA) | ReporterScore (R package developed in this study) | Find significant metabolites (first report), pathways, and taxonomy based on the p-values for multi-omics data. |
| FCS | Significance Analysis of Function and Expression (SAFE) | safe (R package) | SAFE assesses the significance of gene categories by calculating both local and global statistics from gene expression data. |
| FCS | Gene Set Analysis (GSA) | GSA (R Package) | GSA was proposed as an improvement of GSEA, using the “maxmean” statistic instead of the weighted sign KS statistic. |
| FCS | Pathway Analysis with Down-weighting of Overlapping Genes (PADOG) | PADOG (R package) | PADOGA assumes that genes associated with fewer pathways have more significant effects than genes associated with more pathways. |
| FCS | Gene Set Variation Analysis (GSVA) | GSVA (R package) | A nonparametric, unsupervised method that transforms gene expression data into gene set scores for downstream differential pathway activity analysis. |
| PT | Topology-based pathway enrichment analysis (TPEA) | TPEA (R package) | Integrate topological properties and global upstream/downstream positions of genes in pathways. |
组学数据常用的富集方法.
ReporterScore 还提供其他的富集方法,如 KO_fisher(fisher.test)、KO_enrich(fisher.test,来自 clusterProfiler)、KO_gsea(GSEA,来自 clusterProfiler)、KO_gsa(GSA,来自 GSA)、KO_safe(SAFE,来自 safe)、KO_padog(PADOG,来自 PADOG)、KO_gsva(GSVA,来自 GSVA)。
输入数据来自 reporter_score,同时支持自定义数据库,因此您可以轻松比较各种富集方法的结果,并进行全面的分析:
# View(reporter_res2$reporter_s)
# reporter_score
filter(reporter_res$reporter_s, abs(ReporterScore) > 1.64, p.adjust < 0.05) %>% pull(ID) -> RS
# fisher
fisher_res <- KO_fisher(reporter_res)
filter(fisher_res, p.adjust < 0.05) %>% pull(ID) -> Fisher
# enricher
enrich_res <- KO_enrich(reporter_res)
filter(enrich_res, p.adjust < 0.05) %>% pull(ID) -> clusterProfiler
# GESA
set.seed(1234)
gsea_res <- KO_gsea(reporter_res, weight = "Z_score")
#> Warning in preparePathwaysAndStats(pathways, stats, minSize, maxSize, gseaParam, : There are ties in the preranked stats (57.15% of the list).
#> The order of those tied genes will be arbitrary, which may produce unexpected results.
#> Warning in fgseaMultilevel(pathways = pathways, stats = stats, minSize =
#> minSize, : For some pathways, in reality P-values are less than 1e-10. You can
#> set the `eps` argument to zero for better estimation.
filter(data.frame(gsea_res), p.adjust < 0.05) %>% pull(ID) -> GSEA

venn_res <- list(GRSA = RS, Fisher = Fisher, CP = clusterProfiler, GSEA = GSEA)
library(pcutils)
venn(venn_res, "network")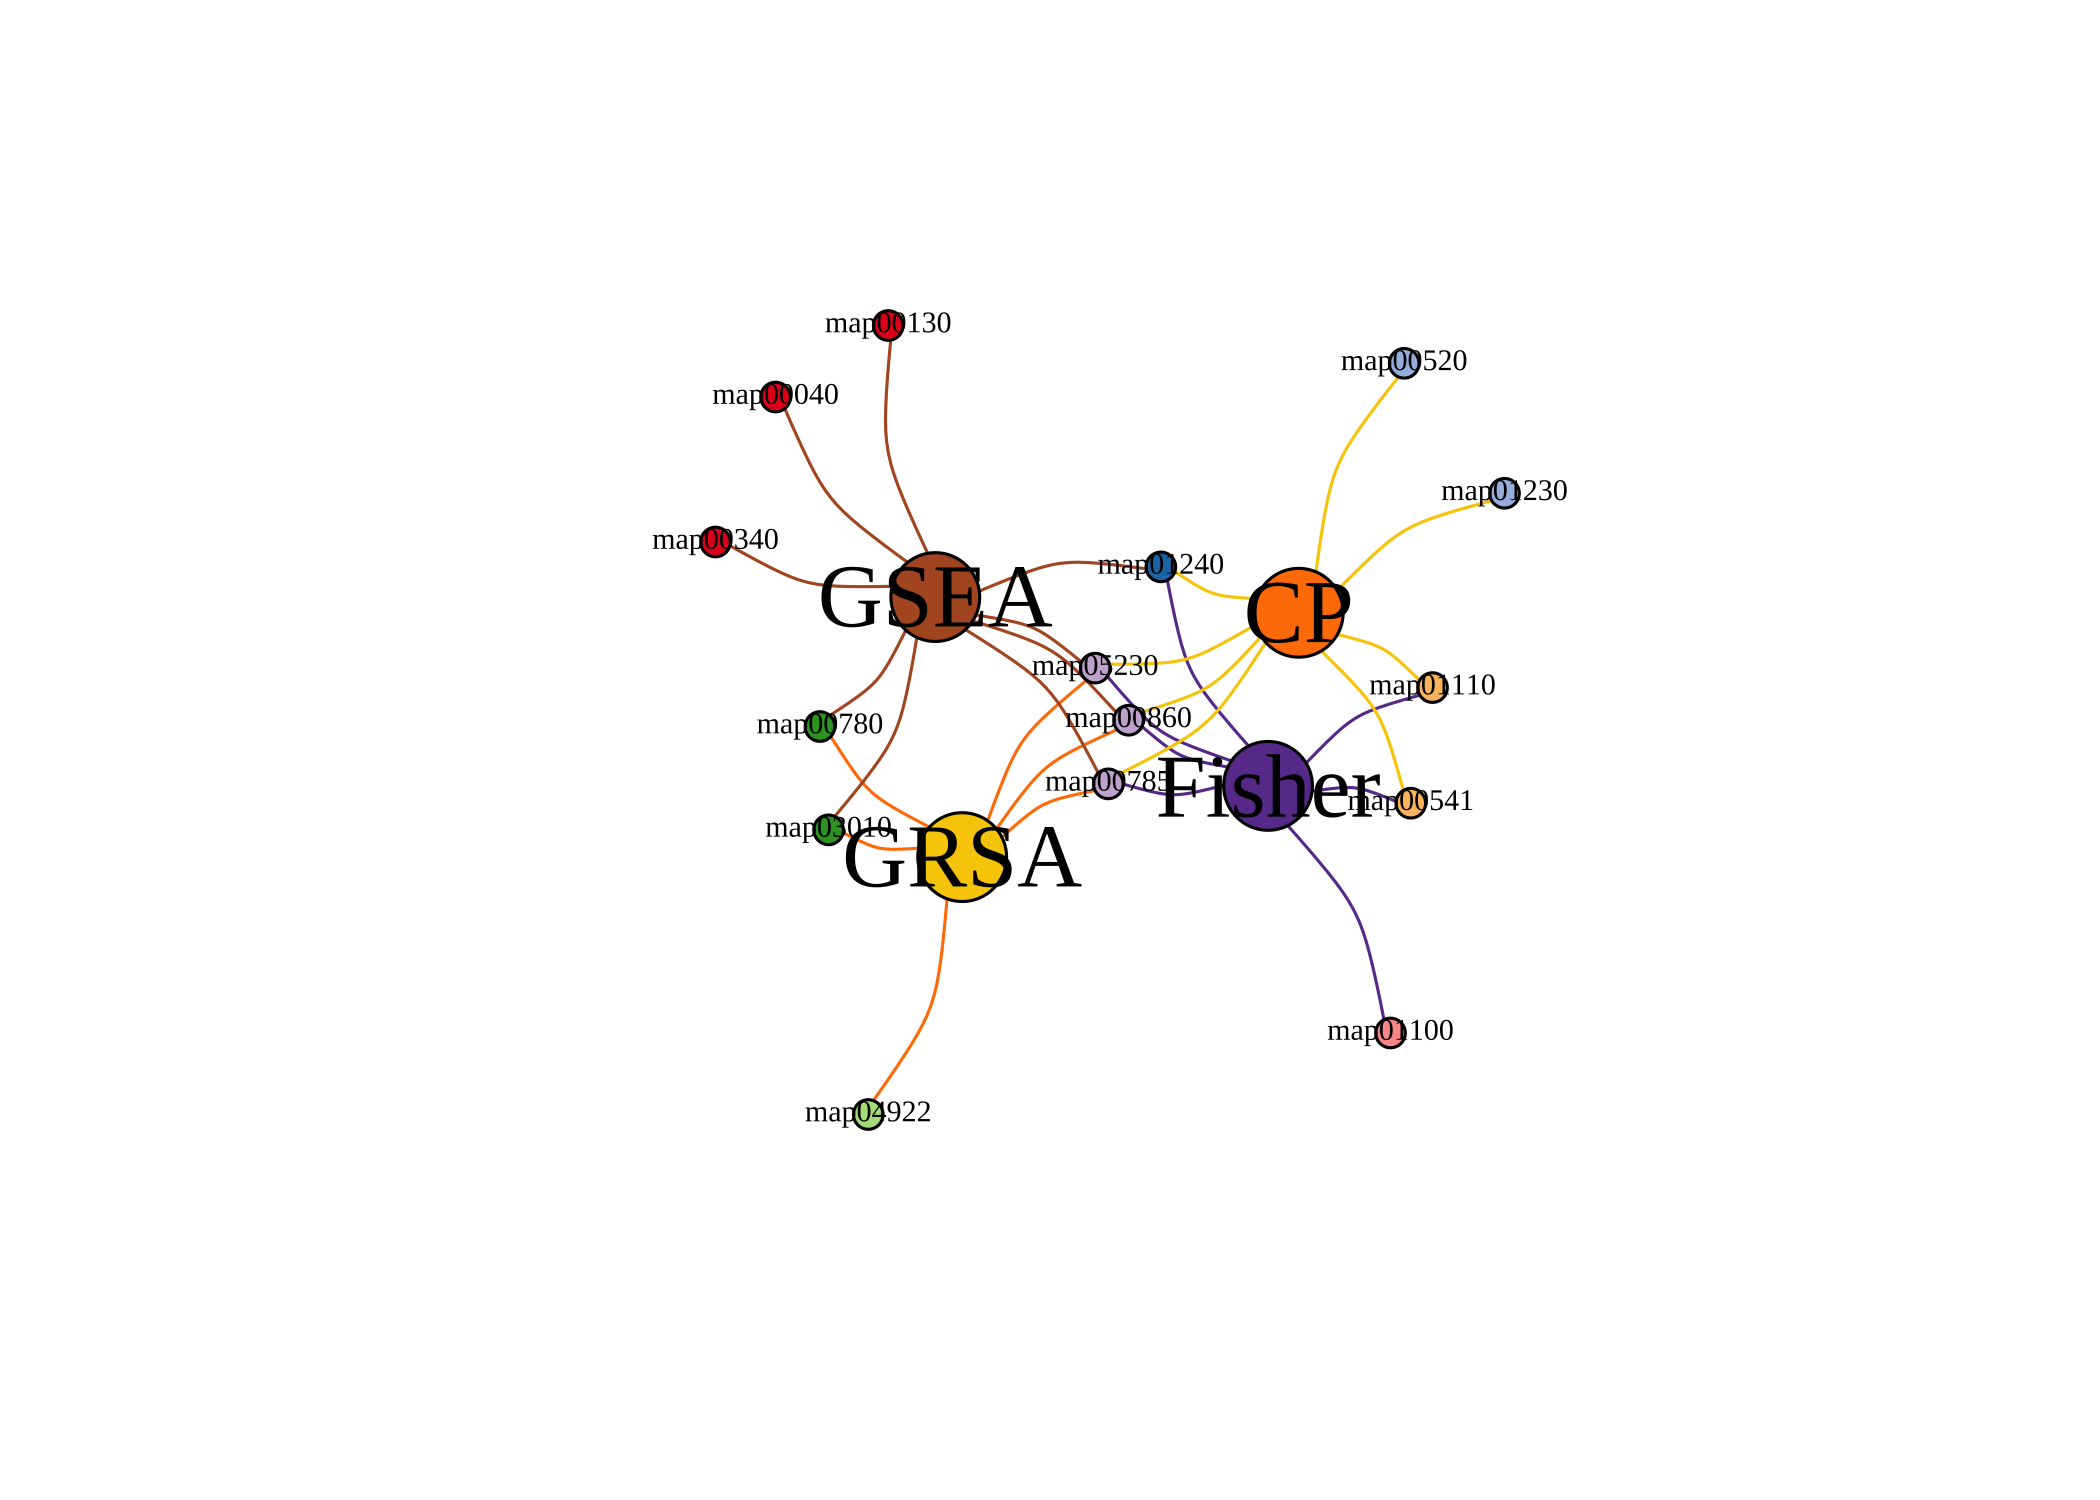
其他功能
KOs高层级整合
KEGG BRITE 是一个层次分类系统的集合,捕捉了各种生物对象的功能层次结构,特别是那些作为 KEGG 对象表示的对象。
我们收集了 k00001 KEGG Orthology (KO) 表,因此您可以总结每个层级的丰度。使用 load_KO_htable 获取 KO_htable,并使用 update_KO_htable 进行更新。使用 up_level_KO 可以将 KOs 升级到特定的层级,例如 “pathway”、”module”、”level1”、”level2”、”level3”、“module1”、“module2”、“module3”。
KO_htable <- load_KO_htable()
#> =================================load KO_htable=================================
#> ==================KO_htable download time: 2024-01-12 00:49:03==================
#> If you want to update KO_htable, use `update_htable(type='ko')`
head(KO_htable)
#>   level1_name             level2_name level3_id                  level3_name
#> 1  Metabolism Carbohydrate metabolism  map00010 Glycolysis / Gluconeogenesis
#> 2  Metabolism Carbohydrate metabolism  map00010 Glycolysis / Gluconeogenesis
#> 3  Metabolism Carbohydrate metabolism  map00010 Glycolysis / Gluconeogenesis
#> 4  Metabolism Carbohydrate metabolism  map00010 Glycolysis / Gluconeogenesis
#> 5  Metabolism Carbohydrate metabolism  map00010 Glycolysis / Gluconeogenesis
#> 6  Metabolism Carbohydrate metabolism  map00010 Glycolysis / Gluconeogenesis
#>    KO_id                                                    KO_name
#> 1 K00844                                HK; hexokinase [EC:2.7.1.1]
#> 2 K12407                              GCK; glucokinase [EC:2.7.1.2]
#> 3 K00845                              glk; glucokinase [EC:2.7.1.2]
#> 4 K25026                              glk; glucokinase [EC:2.7.1.2]
#> 5 K01810       GPI, pgi; glucose-6-phosphate isomerase [EC:5.3.1.9]
#> 6 K06859 pgi1; glucose-6-phosphate isomerase, archaeal [EC:5.3.1.9]
plot_htable(type = "ko")
#> =================================load KO_htable=================================
#> ==================KO_htable download time: 2024-01-12 00:49:03==================
#> If you want to update KO_htable, use `update_htable(type='ko')`
#> Warning: Vectorized input to `element_text()` is not officially supported.
#> ℹ Results may be unexpected or may change in future versions of ggplot2.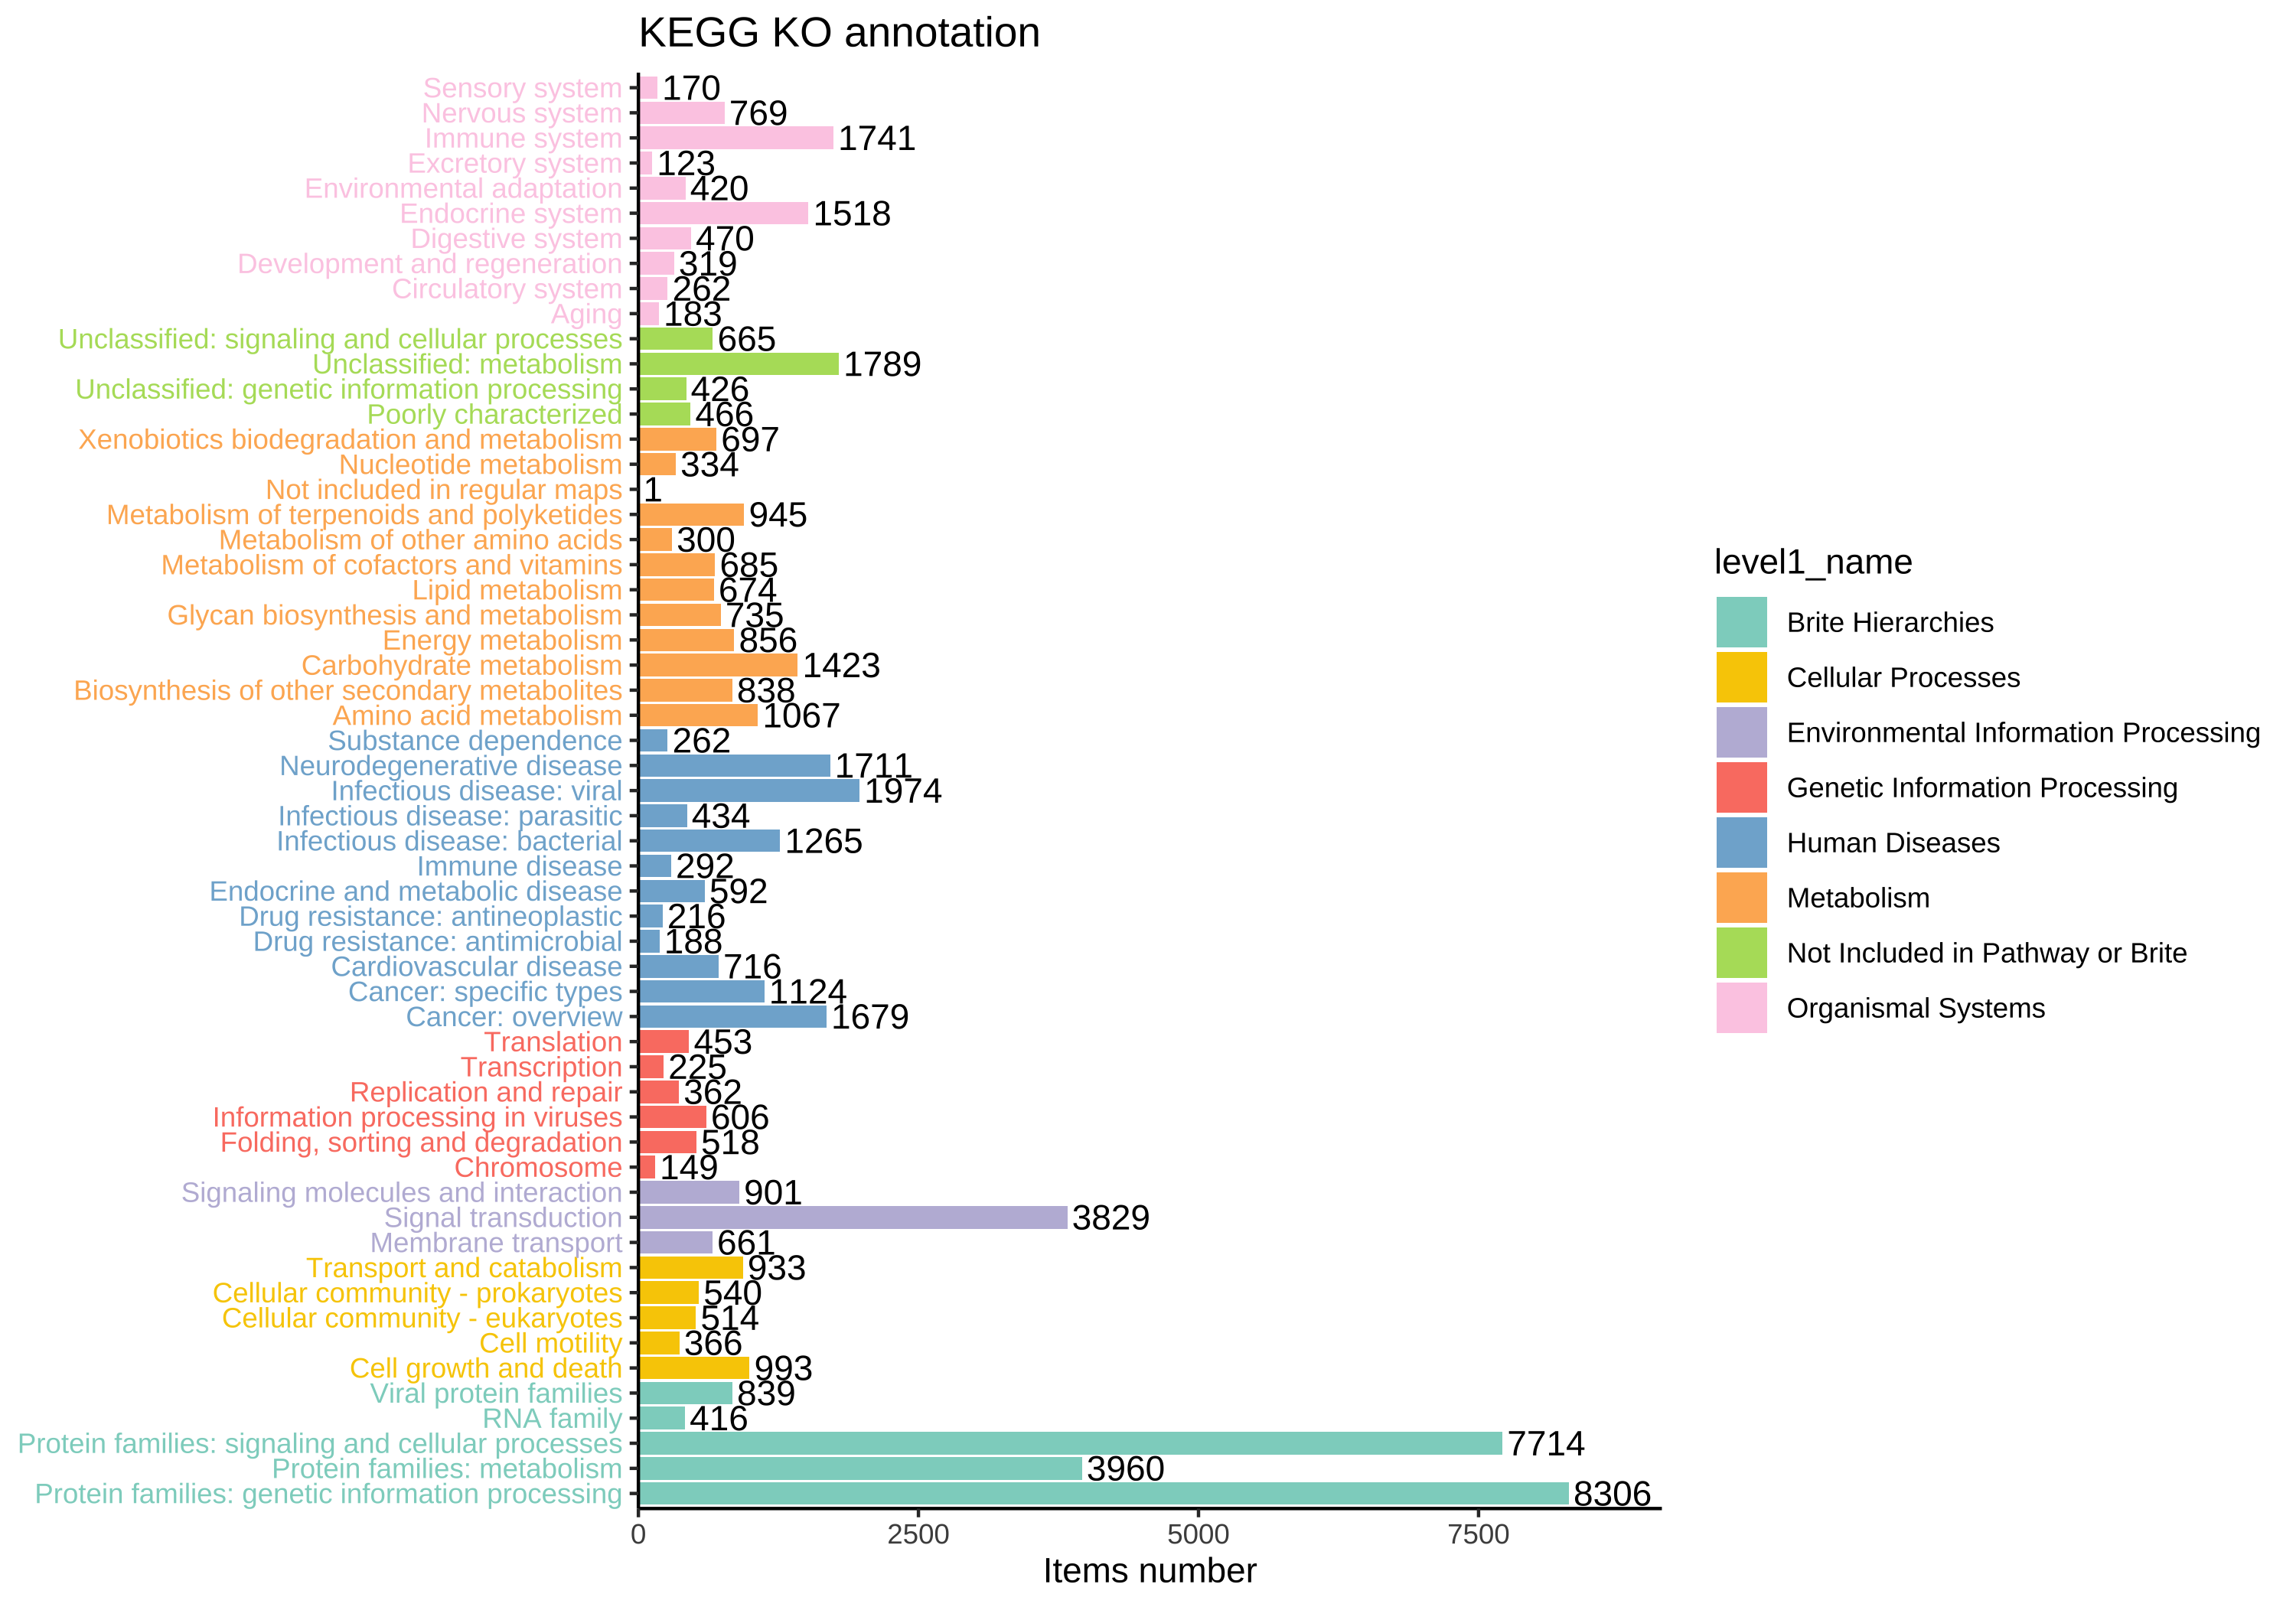
KO_level1 <- up_level_KO(KO_abundance, level = "level1", show_name = TRUE)
#> =================================load KO_htable=================================
#> ==================KO_htable download time: 2024-01-12 00:49:03==================
#> If you want to update KO_htable, use `update_htable(type='ko')`
pcutils::stackplot(KO_level1[-which(rownames(KO_level1) == "Unknown"), ]) +
  ggsci::scale_fill_d3() +
  theme(axis.text.x = element_text(angle = 90, hjust = 1, vjust = 0.5))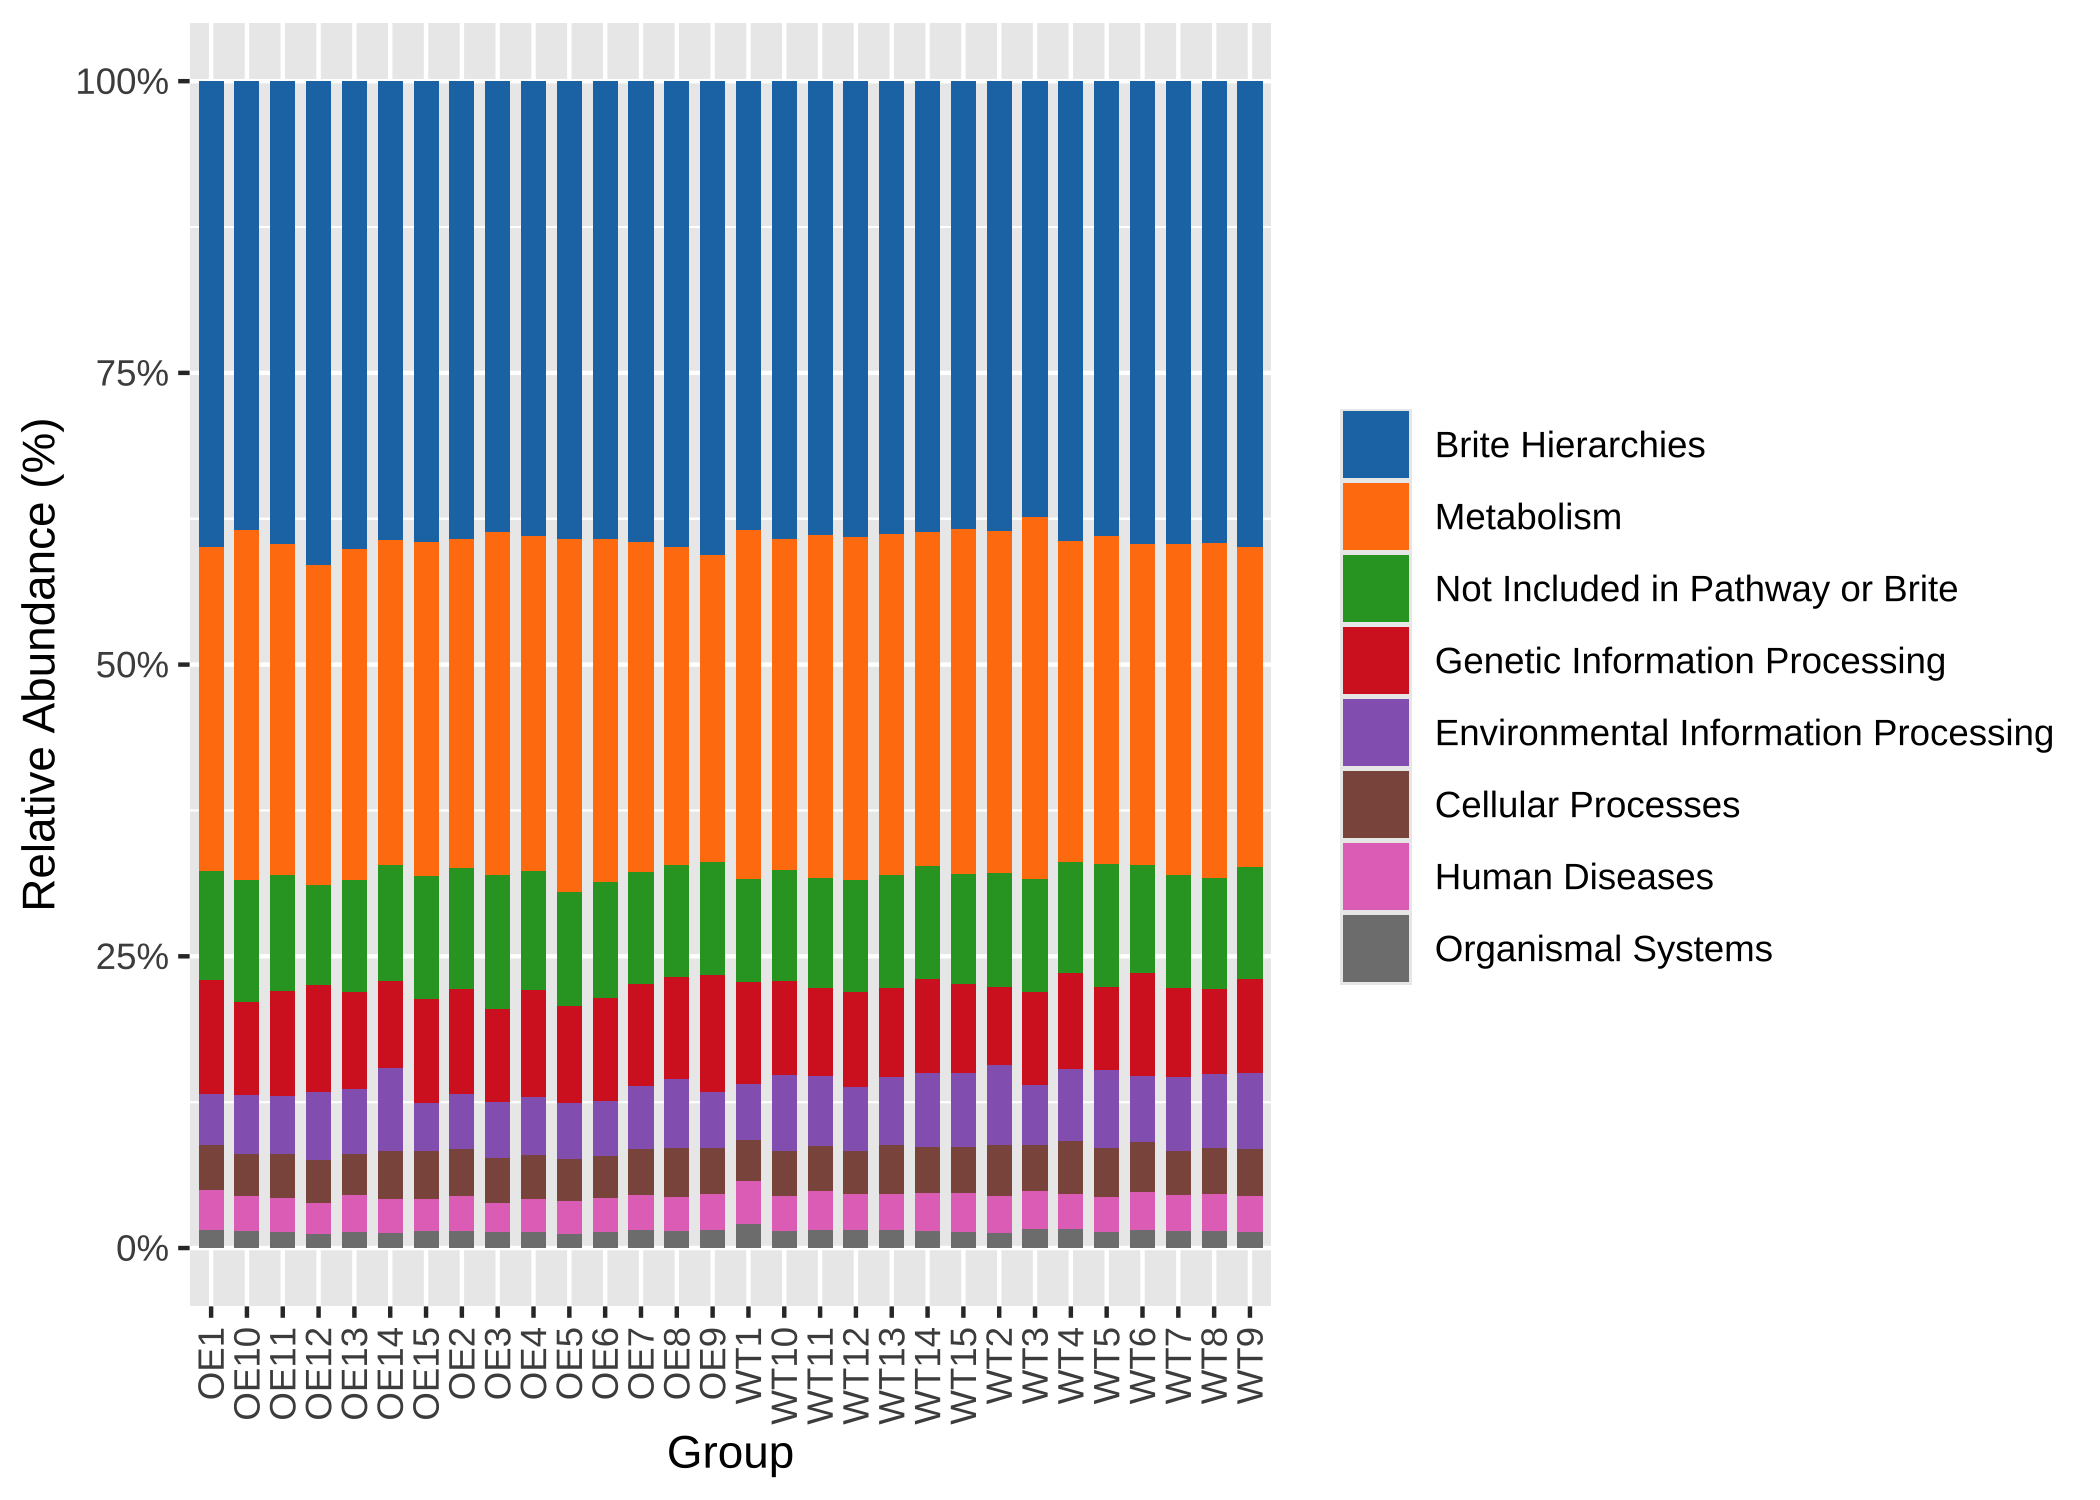
CARD for ARGs
为了方便,我还整合了CARD数据库的描述信息 https://card.mcmaster.ca/download/0/broadstreet-v4.0.0.tar.bz2 .
CARDinfo <- load_CARDinfo()
#> =================================load CARDinfo==================================
#> ==================CARDinfo download time: 2024-01-12 01:12:11===================
#> If you want to update CARDinfo, use `update_GOlist()`
head(CARDinfo$ARO_index)
#>         ARO Accession CVTERM ID Model Sequence ID Model ID
#> 3005099   ARO:3005099     43314              6143     3831
#> 3002523   ARO:3002523     38923              8144     1781
#> 3002524   ARO:3002524     38924                85      746
#> 3002525   ARO:3002525     38925              4719     1246
#> 3002526   ARO:3002526     38926               228     1415
#> 3002527   ARO:3002527     38927              5510     2832
#>                                                     Model Name
#> 3005099 23S rRNA (adenine(2058)-N(6))-methyltransferase Erm(A)
#> 3002523                                             AAC(2')-Ia
#> 3002524                                             AAC(2')-Ib
#> 3002525                                             AAC(2')-Ic
#> 3002526                                             AAC(2')-Id
#> 3002527                                             AAC(2')-Ie
#>                                                       ARO Name
#> 3005099 23S rRNA (adenine(2058)-N(6))-methyltransferase Erm(A)
#> 3002523                                             AAC(2')-Ia
#> 3002524                                             AAC(2')-Ib
#> 3002525                                             AAC(2')-Ic
#> 3002526                                             AAC(2')-Id
#> 3002527                                             AAC(2')-Ie
#>         Protein Accession DNA Accession                         AMR Gene Family
#> 3005099        AAB60941.1    AF002716.1 Erm 23S ribosomal RNA methyltransferase
#> 3002523        AAA03550.1      L06156.2                                 AAC(2')
#> 3002524        AAC44793.1      U41471.1                                 AAC(2')
#> 3002525        CCP42991.1    AL123456.3                                 AAC(2')
#> 3002526        AAB41701.1      U72743.1                                 AAC(2')
#> 3002527        CAC32082.1    AL583926.1                                 AAC(2')
#>                                                                   Drug Class
#> 3005099 lincosamide antibiotic;macrolide antibiotic;streptogramin antibiotic
#> 3002523                                            aminoglycoside antibiotic
#> 3002524                                            aminoglycoside antibiotic
#> 3002525                                            aminoglycoside antibiotic
#> 3002526                                            aminoglycoside antibiotic
#> 3002527                                            aminoglycoside antibiotic
#>                 Resistance Mechanism CARD Short Name
#> 3005099 antibiotic target alteration  Spyo_ErmA_MLSb
#> 3002523      antibiotic inactivation      AAC(2')-Ia
#> 3002524      antibiotic inactivation      AAC(2')-Ib
#> 3002525      antibiotic inactivation      AAC(2')-Ic
#> 3002526      antibiotic inactivation      AAC(2')-Id
#> 3002527      antibiotic inactivation      AAC(2')-Ie
CAZy for CAZymes
为了方便,我还整合了CAZy数据库的描述信息 https://bcb.unl.edu/dbCAN2/download/Databases/V12/ .
CAZy_info <- load_CAZy_info()
#> =================================load CAZy_info=================================
#> ==================CAZy_info download time: 2025-03-14 01:10:20==================
#> If you want to update CAZy_info, use `update_CAZy_info()`
head(CAZy_info$fam_subfam_ec)
#>   Sub_family  Accession       EC
#> 1      AA1_1 AAA33103.1 1.10.3.2
#> 2      AA1_1 AAA33104.1 1.10.3.2
#> 3      AA1_1 AAA86659.1 1.10.3.2
#> 4      AA1_1 AAC41686.1 1.10.3.2
#> 5      AA1_1 AAC41687.1 1.10.3.2
#> 6      AA1_1 AAC49828.1 1.10.3.2
Enzymes
为了方便,我还整合了Enzymes数据库的描述信息 https://ftp.expasy.org/databases/enzyme/ .
Enzyme_info <- load_Enzyme_info()
#> ================================load Enzyme_info================================
#> =================Enzyme_info download time: 2025-03-24 14:51:45=================
#> If you want to update Enzyme_info, use `update_Enzyme_info()`
head(Enzyme_info$enzclass_df)
#>        EC                         Description
#> 1 1.-.-.-                     Oxidoreductases
#> 2 1.1.-.- Acting on the CH-OH group of donors
#> 3 1.1.1.-  With NAD(+) or NADP(+) as acceptor
#> 4 1.1.2.-       With a cytochrome as acceptor
#> 5 1.1.3.-             With oxygen as acceptor
#> 6 1.1.4.-        With a disulfide as acceptor
或者使用KEGG酶htable:
load_Enzyme_htable() -> Enzyme_htable
library(pctax)
ann_tree(distinct(Enzyme_htable[, 1:3])) -> Enzyme_tr
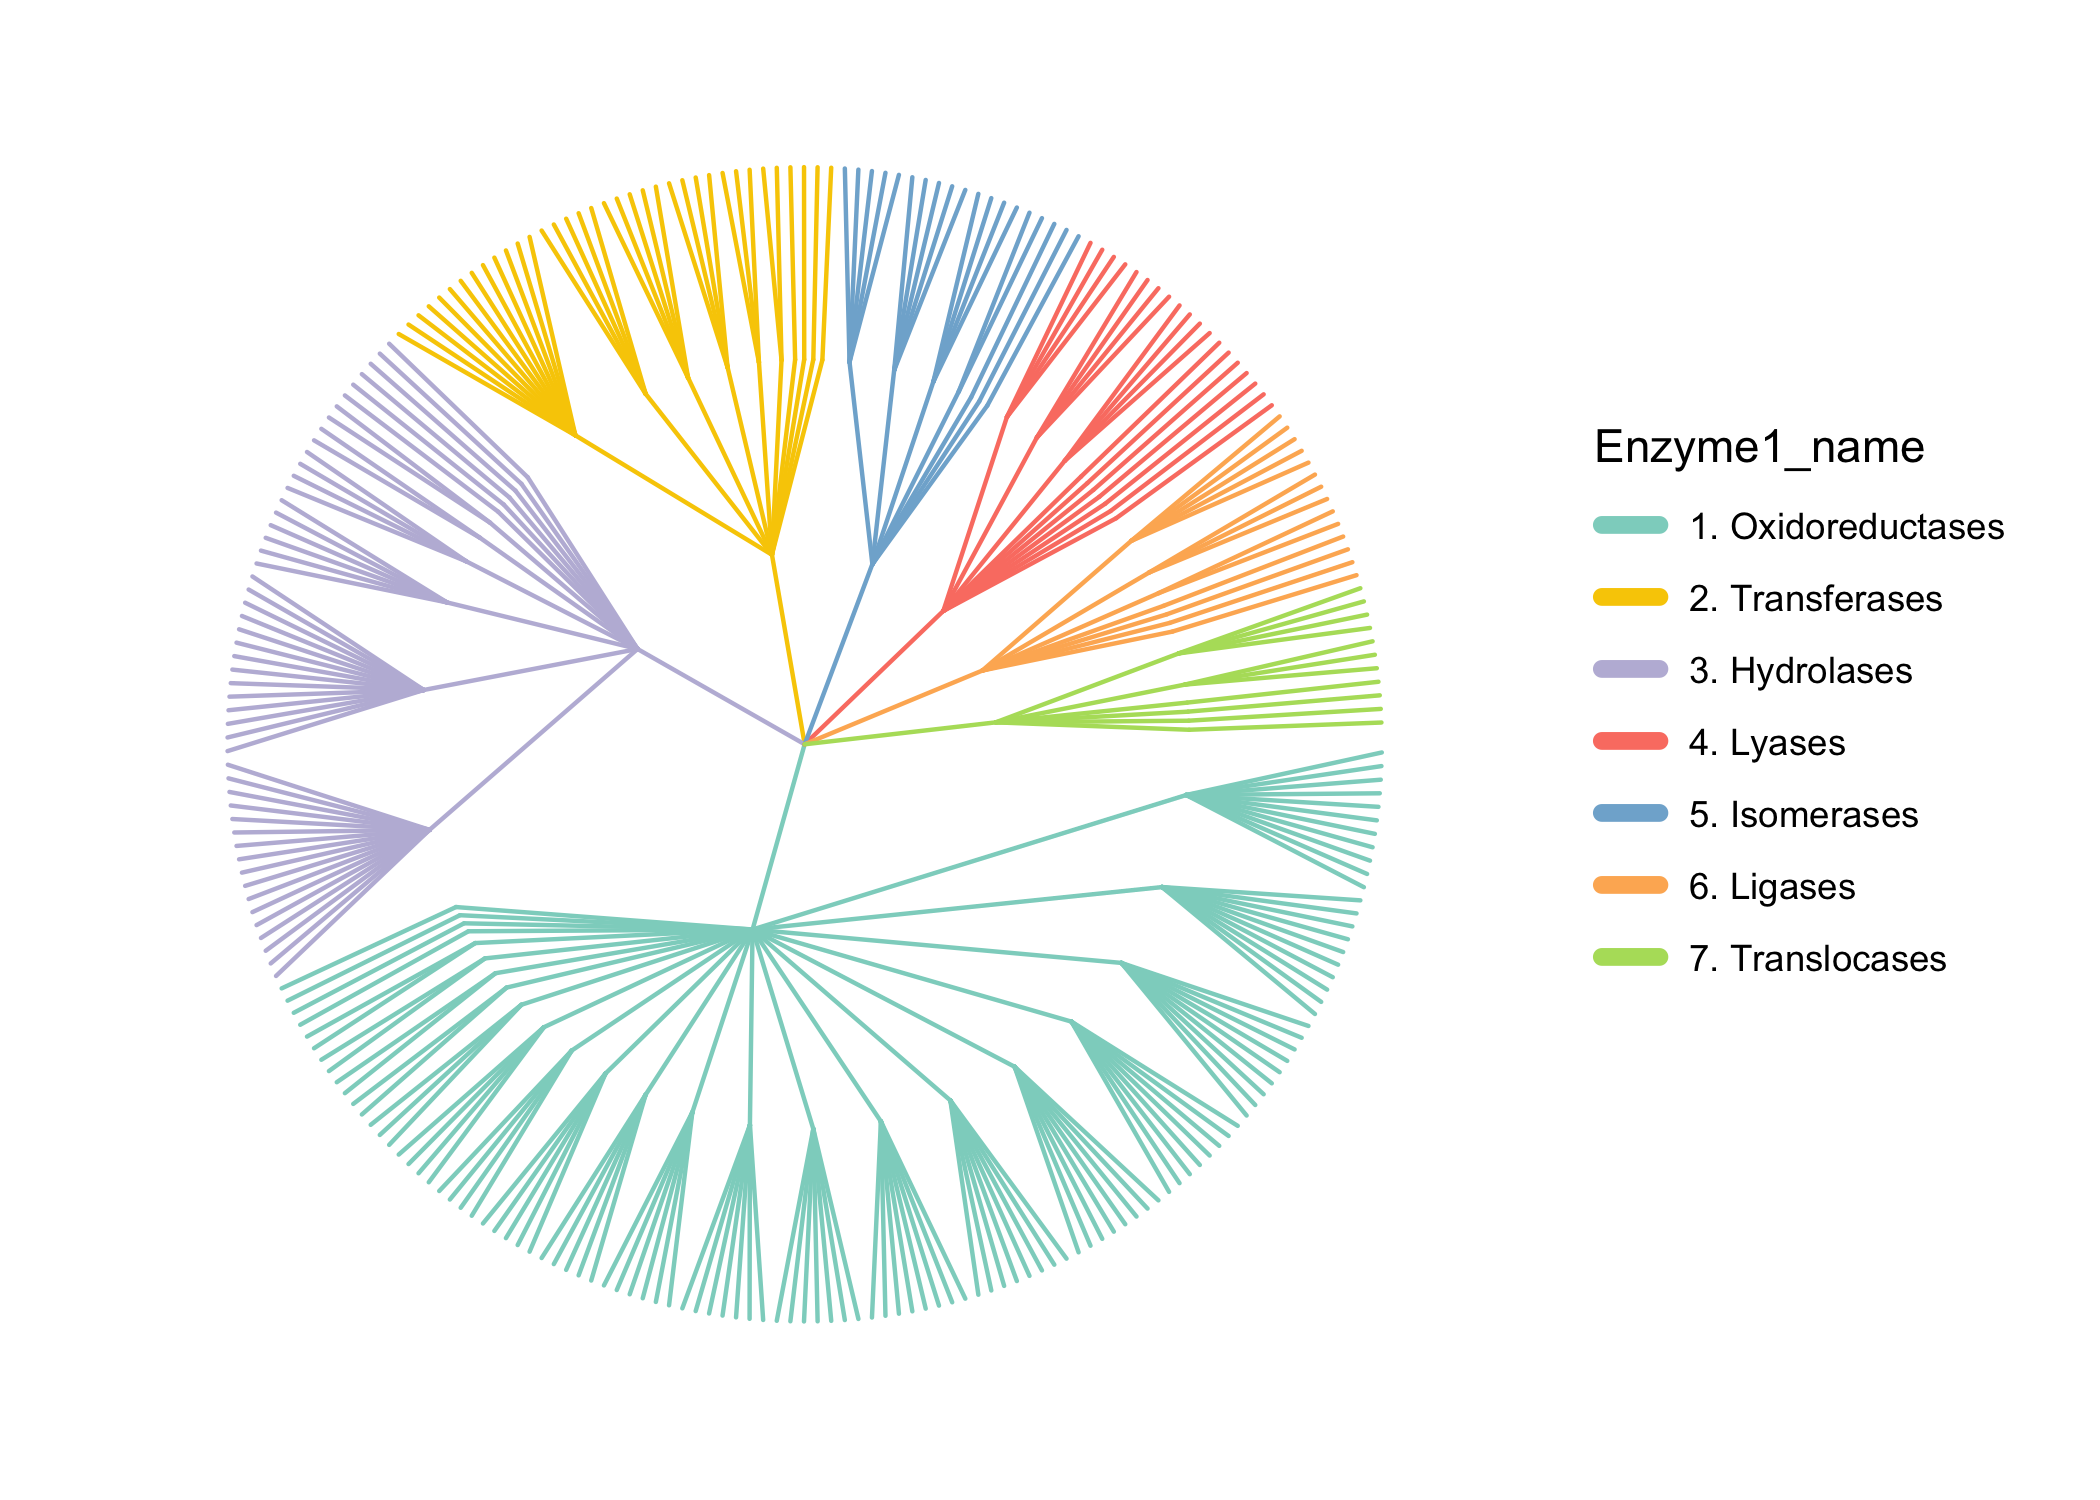
easy_tree(Enzyme_tr, highlight = "Enzyme1_name", add_abundance = F, add_tiplab = F)