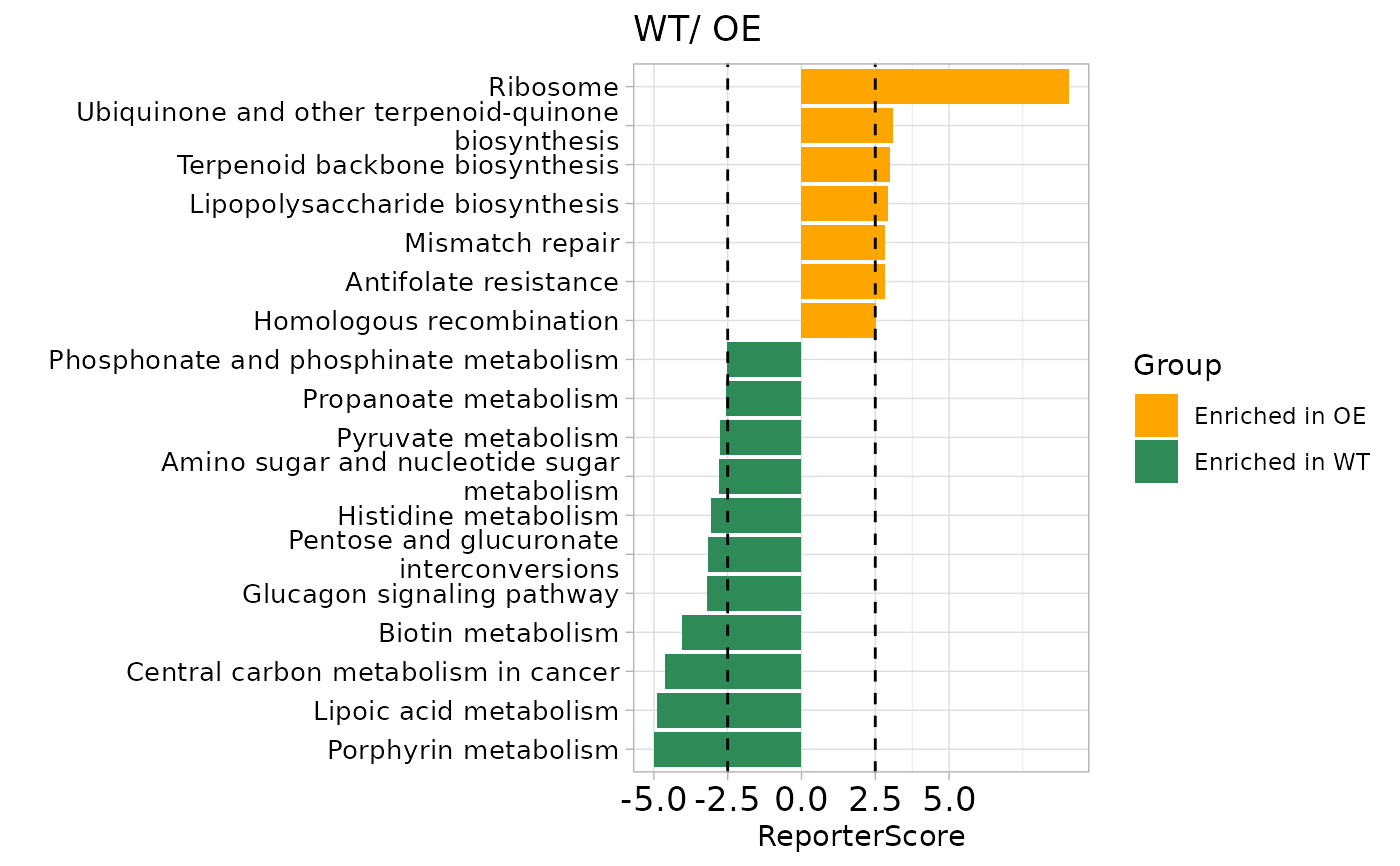
Plot the reporter_res
plot_report(
  reporter_res,
  rs_threshold = 1.64,
  mode = 1,
  y_text_size = 13,
  str_width = 100,
  show_ID = FALSE,
  Pathway_description = TRUE,
  facet_level = FALSE,
  facet_anno = NULL,
  facet_str_width = 15,
  plot_line = TRUE,
  reorder = FALSE
)
Arguments
- reporter_res
result of `get_reporter_score` or `reporter_score`
- rs_threshold
plot threshold vector, default:1.64
- mode
1~3 plot style.
- y_text_size
y_text_size
- str_width
str_width to wrap
- show_ID
show pathway id
- Pathway_description
show KO description rather than KO id.
- facet_level
facet plot if the type is "pathway" or "module"
- facet_anno
annotation table for facet, two columns, first is level summary, second is pathway id.
- facet_str_width
str width for facet label
- plot_line
plot line or not
- reorder
reorder the order of the pathways
Value
ggplot