Plot htable levels
plot_htable(type = "ko", select = NULL, htable = NULL)Value
ggplot
Examples
# \donttest{
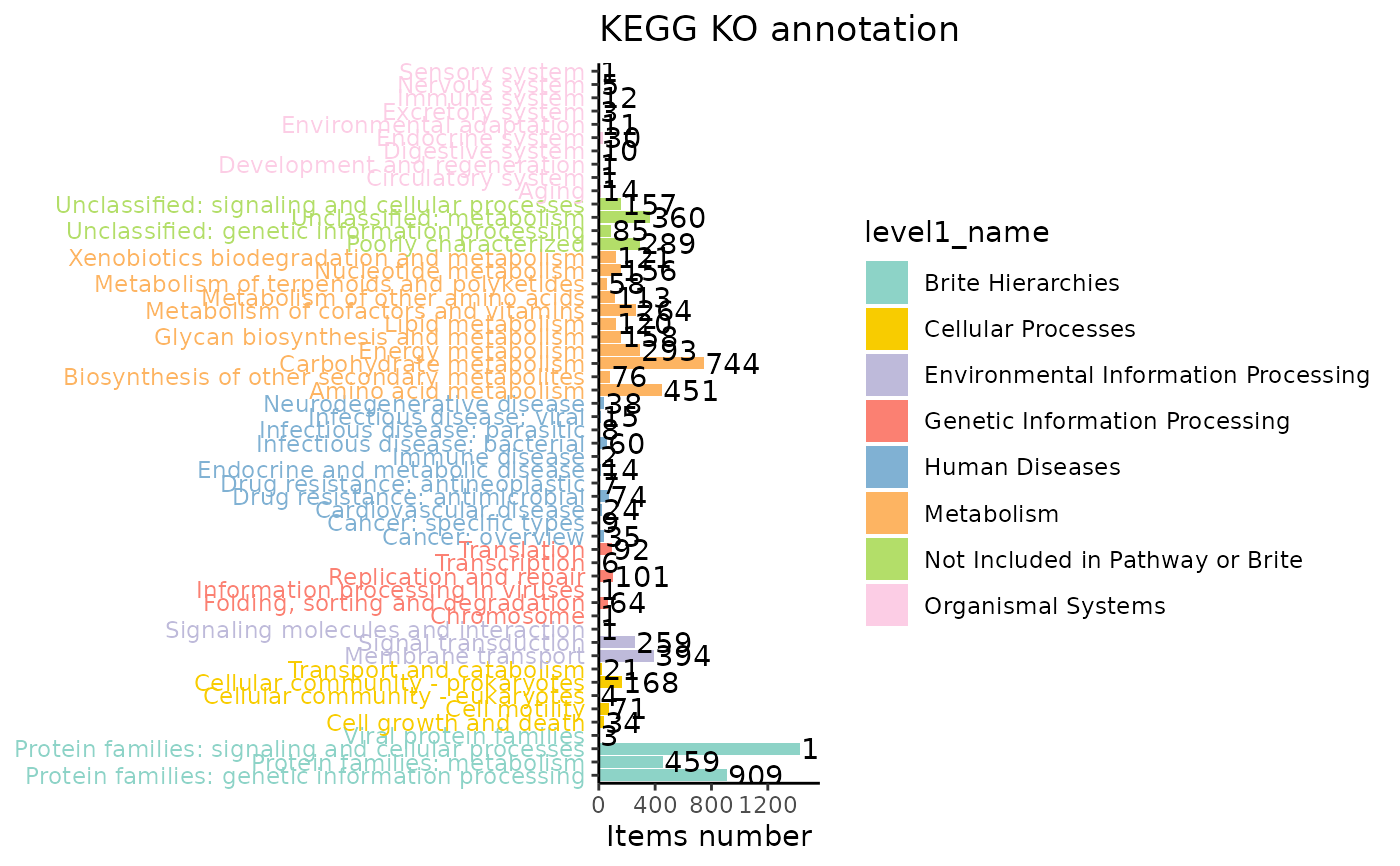
data("KO_abundance_test")
plot_htable(select = rownames(KO_abundance))
#> =================================load KO_htable=================================
#> ==============KO_htable download time: 2023-07-31 03:21:54.040036===============
#> If you want to update KO_htable, use `update_htable(type='ko')`
 # }
# }