Plot features trend in one pathway or module
plot_features_in_pathway(
  ko_stat,
  map_id = "map00780",
  modulelist = NULL,
  select_ko = NULL,
  box_color = reporter_color,
  show_number = TRUE,
  scale = FALSE,
  feature_type = "KOs",
  line_color = c(Depleted = "seagreen", Enriched = "orange", None = "grey", Significant =
    "red2")
)
Arguments
- ko_stat
ko_stat result from
pvalue2zsor result of `get_reporter_score`- map_id
the pathway or module id
- modulelist
NULL or customized modulelist dataframe, must contain "id","K_num","KOs","Description" columns. Take the `KOlist` as example, use
custom_modulelist.- select_ko
select which ko
- box_color
box and point color, default: c("#e31a1c","#1f78b4")
- show_number
show the numbers.
- scale
scale the data by row.
- feature_type
show in the title ,default: KOs
- line_color
line color, default: c("Depleted"="seagreen","Enriched"="orange","None"="grey")
Value
ggplot
Examples
# \donttest{
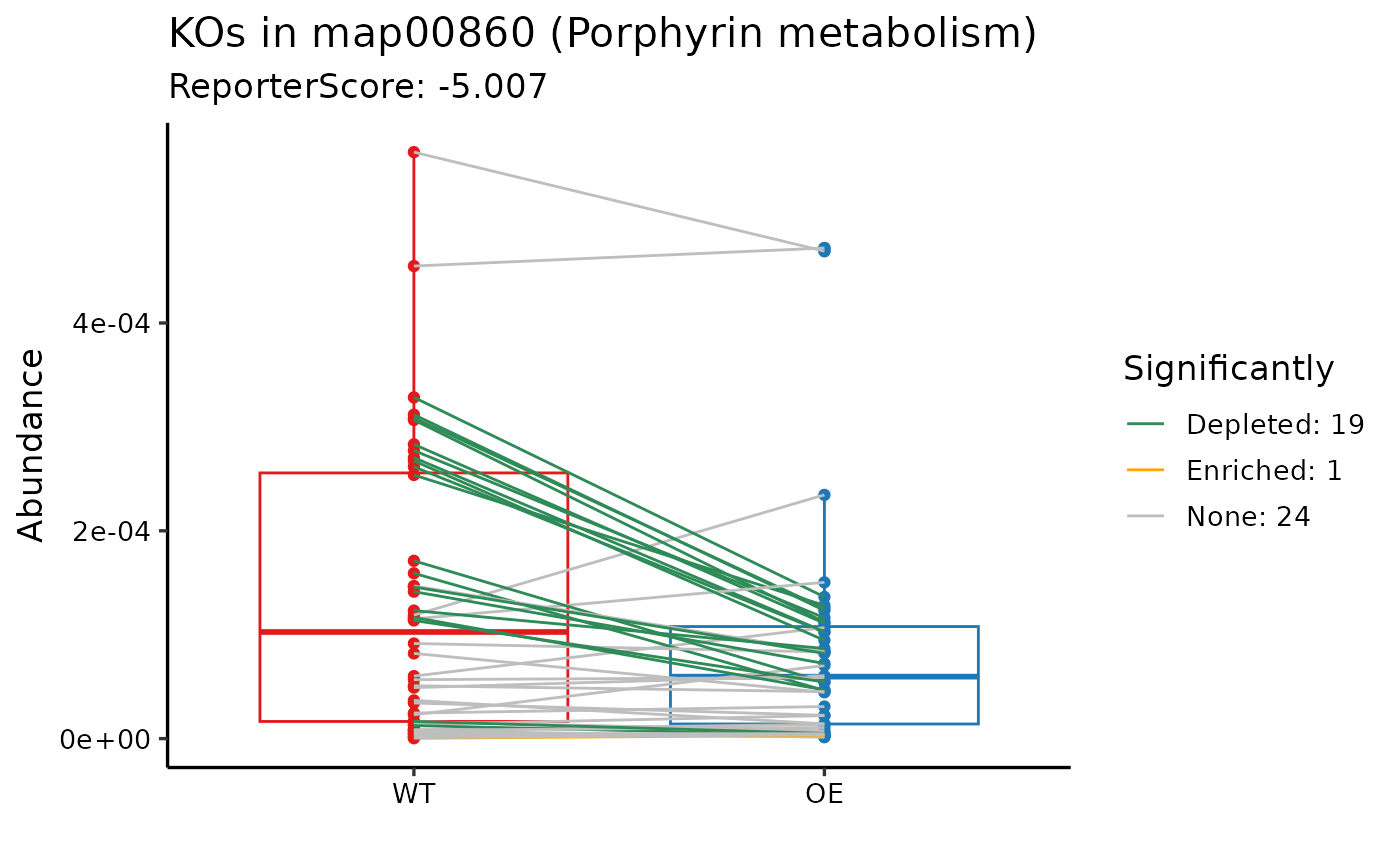
data("reporter_score_res")
plot_features_in_pathway(ko_stat = reporter_score_res, map_id = "map00860")
 # }
# }