Plot features boxplot
plot_features_box(
  kodf,
  group = NULL,
  metadata = NULL,
  map_id = "map00780",
  select_ko = NULL,
  only_sig = FALSE,
  box_param = NULL,
  modulelist = NULL,
  KO_description = FALSE,
  str_width = 50
)
Arguments
- kodf
KO_abundance table, rowname is ko id (e.g. K00001),colnames is samples. or result of `get_reporter_score`
- group
The compare group (two category) in your data, one column name of metadata when metadata exist or a vector whose length equal to columns number of kodf.
- metadata
metadata
- map_id
the pathway or module id
- select_ko
select which ko
- only_sig
only show the significant features
- box_param
parameters pass to
group_box- modulelist
NULL or customized modulelist dataframe, must contain "id","K_num","KOs","Description" columns. Take the `KOlist` as example, use
custom_modulelist.- KO_description
show KO description rather than KO id.
- str_width
str_width to wrap
Value
ggplot
Examples
# \donttest{
data("reporter_score_res")
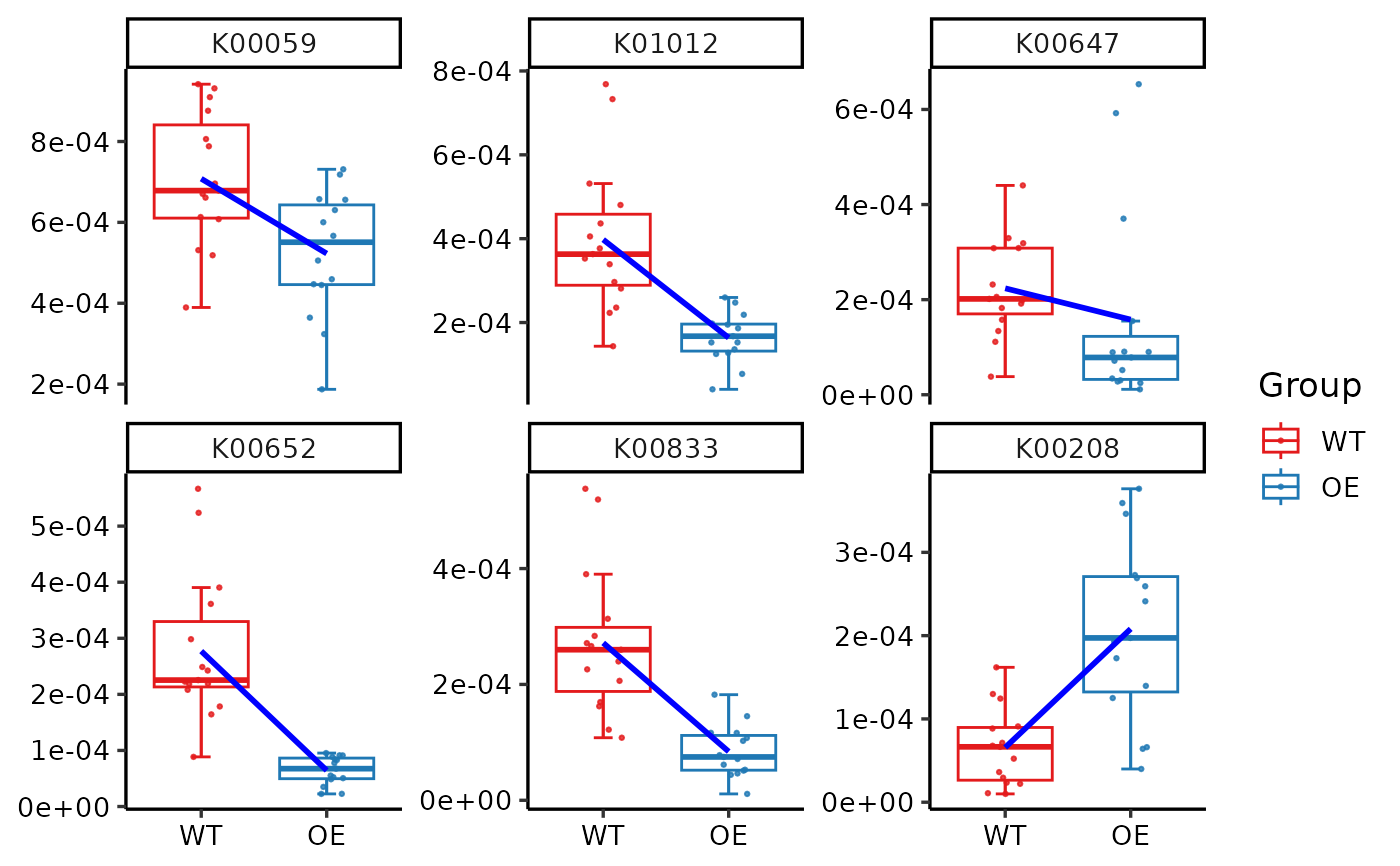
plot_features_box(reporter_score_res,
select_ko = c("K00059", "K00208", "K00647", "K00652", "K00833", "K01012"),
box_param = list(p_value1 = FALSE, trend_line = TRUE)
)
#> `geom_smooth()` using formula = 'y ~ x'
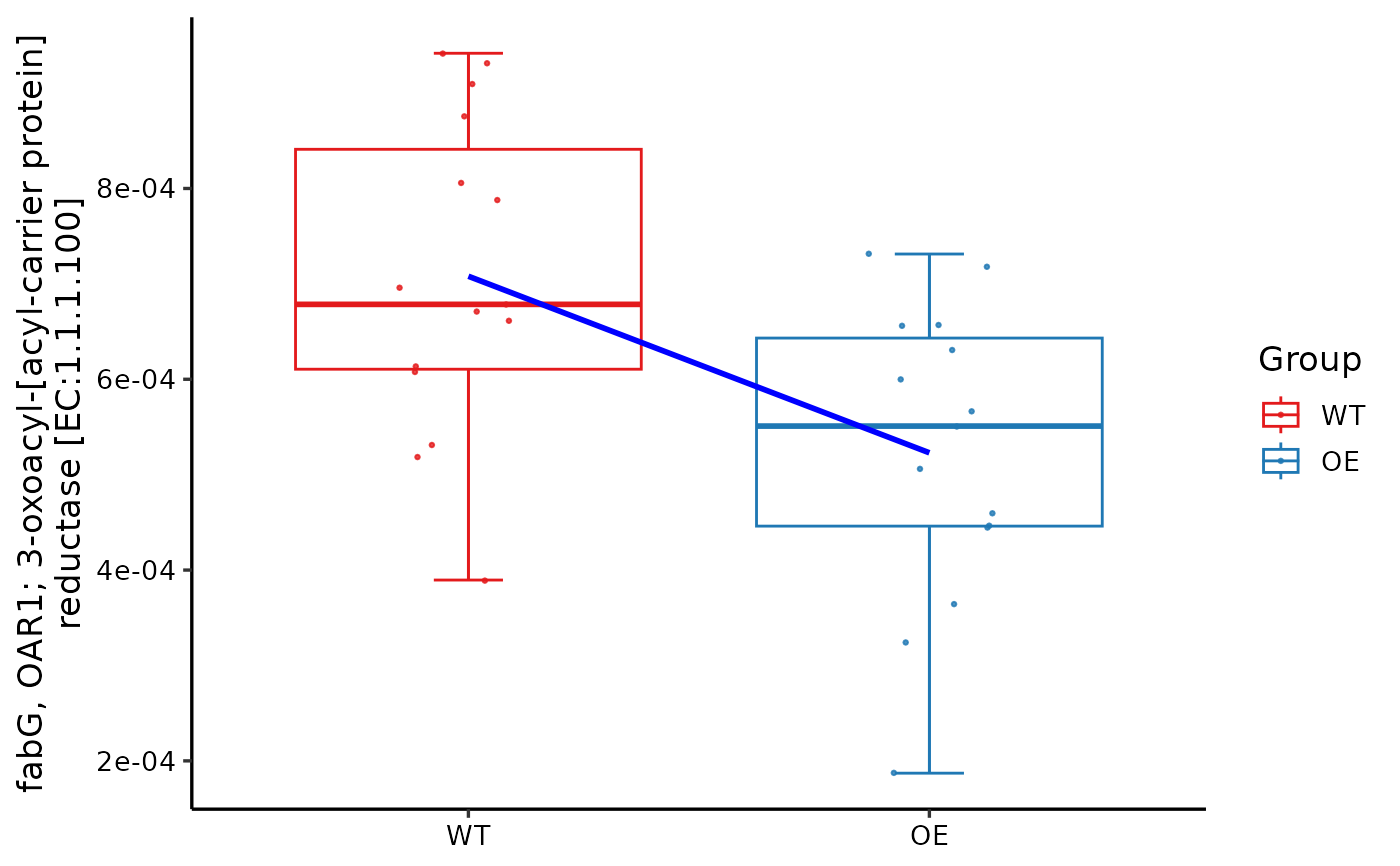
 plot_features_box(reporter_score_res,
select_ko = "K00059", KO_description = TRUE,
box_param = list(p_value1 = FALSE, trend_line = TRUE)
)
#> =================================load KO_htable=================================
#> ==============KO_htable download time: 2023-07-31 03:21:54.040036===============
#> If you want to update KO_htable, use `update_htable(type='ko')`
#> `geom_smooth()` using formula = 'y ~ x'
plot_features_box(reporter_score_res,
select_ko = "K00059", KO_description = TRUE,
box_param = list(p_value1 = FALSE, trend_line = TRUE)
)
#> =================================load KO_htable=================================
#> ==============KO_htable download time: 2023-07-31 03:21:54.040036===============
#> If you want to update KO_htable, use `update_htable(type='ko')`
#> `geom_smooth()` using formula = 'y ~ x'
 # }
# }