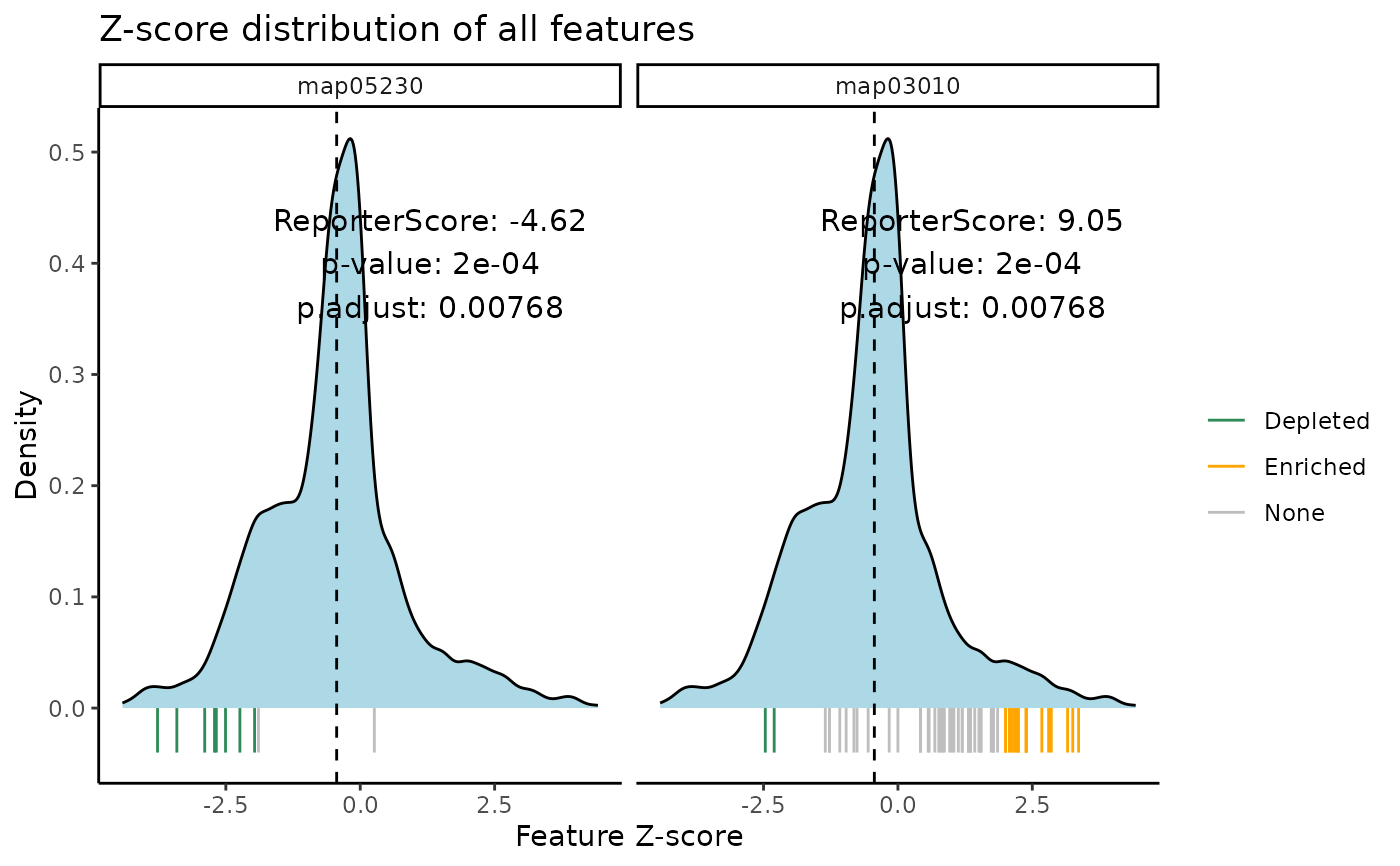
plot the Z-score of features distribution
plot_features_distribution(
  reporter_res,
  map_id,
  text_size = 4,
  text_position = NULL,
  rug_length = 0.04
)
Arguments
Value
ggplot
plot the Z-score of features distribution
plot_features_distribution(
reporter_res,
map_id,
text_size = 4,
text_position = NULL,
rug_length = 0.04
)ggplot