9 User interface
9.1 Dashboard
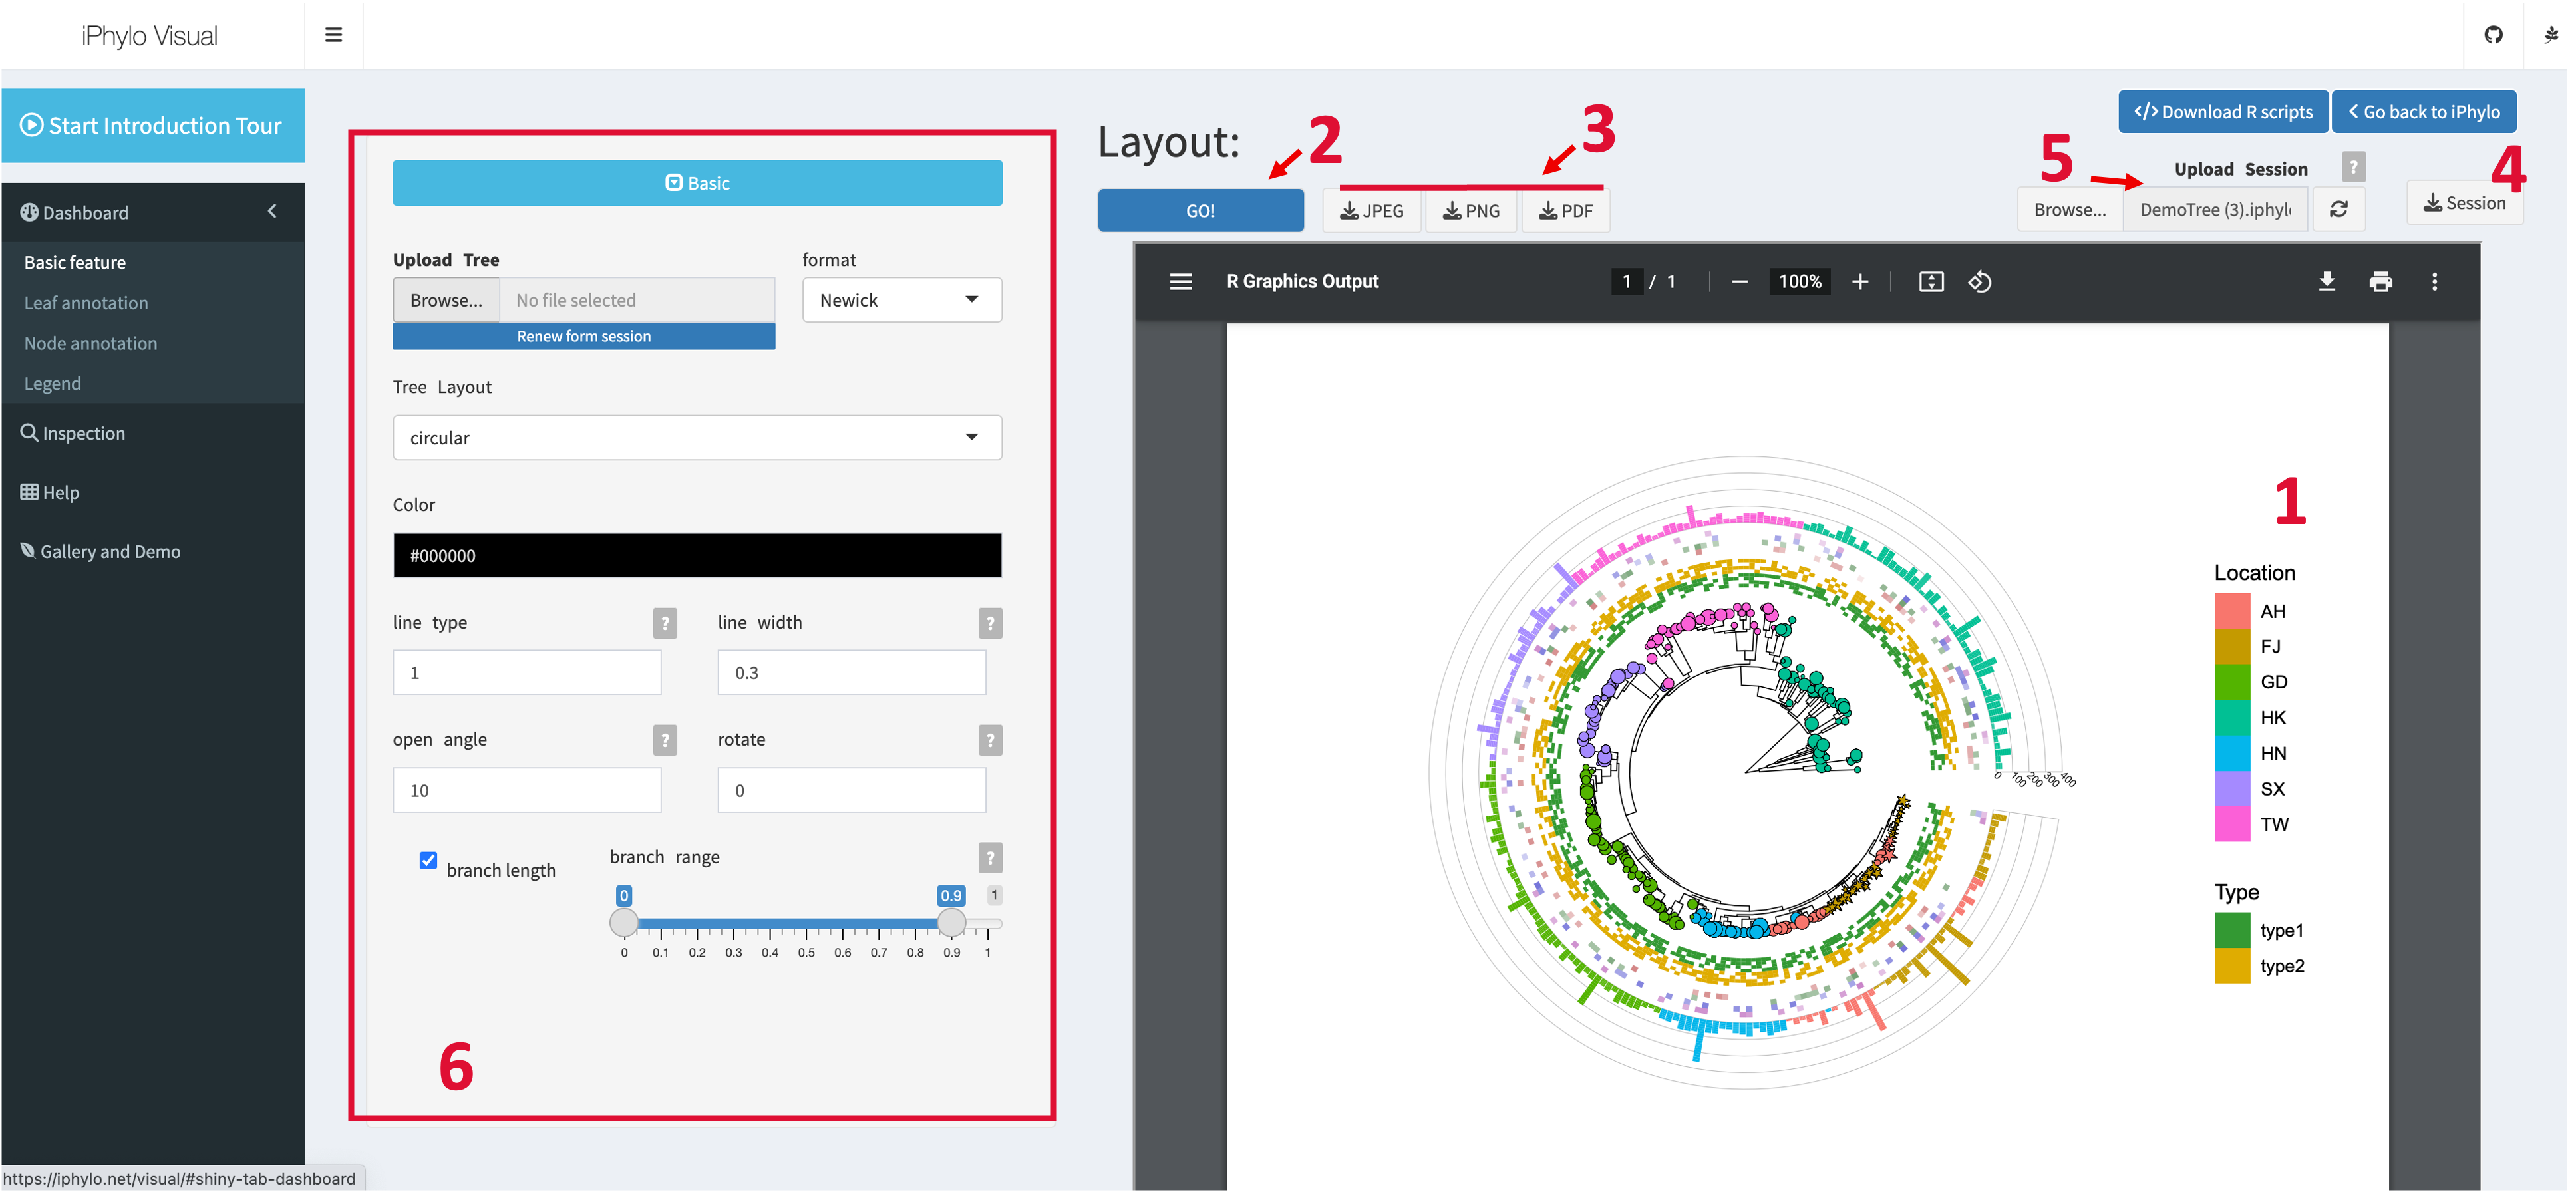
The dashboard page hosts the main annotation and display functions of iPhylo Visual. The user interface consists of several main components:
- Tree Display: The tree will be displayed in the main panel of the webpage in the form of a vector image. Click the plus (+) and minus (-) buttons on the display panel to zoom in and out of the tree visualization. Move and scroll the mouse cursor to move the visualization within the display panel.
- Refresh Plot: Once the user uploads a tree file, the GO button, which is used to refresh the graphical representation of the tree file, will become enabled. To ensure optimal performance, adjustments made to the display or annotation parameters will not immediately update the tree image. Instead, you need to click the “GO” button to refresh the image after modifying any settings.
- Download Plot: Click the JPEG, PNG or PDF download button to get the visualization in preferred formats.
- Download Session:Click the Session button to download the “.iphylo” project file, as detailed in the Session section.
- Upload Session: The session upload widget allows users to upload previously saved project files. Click the reload button to restore session data. You need to click the GO button to get the session visualization.
- Basic Controls: This is the basic control panel. iPhylo Visual’s basic controls allow users to adjust the fundamental attributes of the tree display. Click the toggle button to collapse or expand the basic control section.
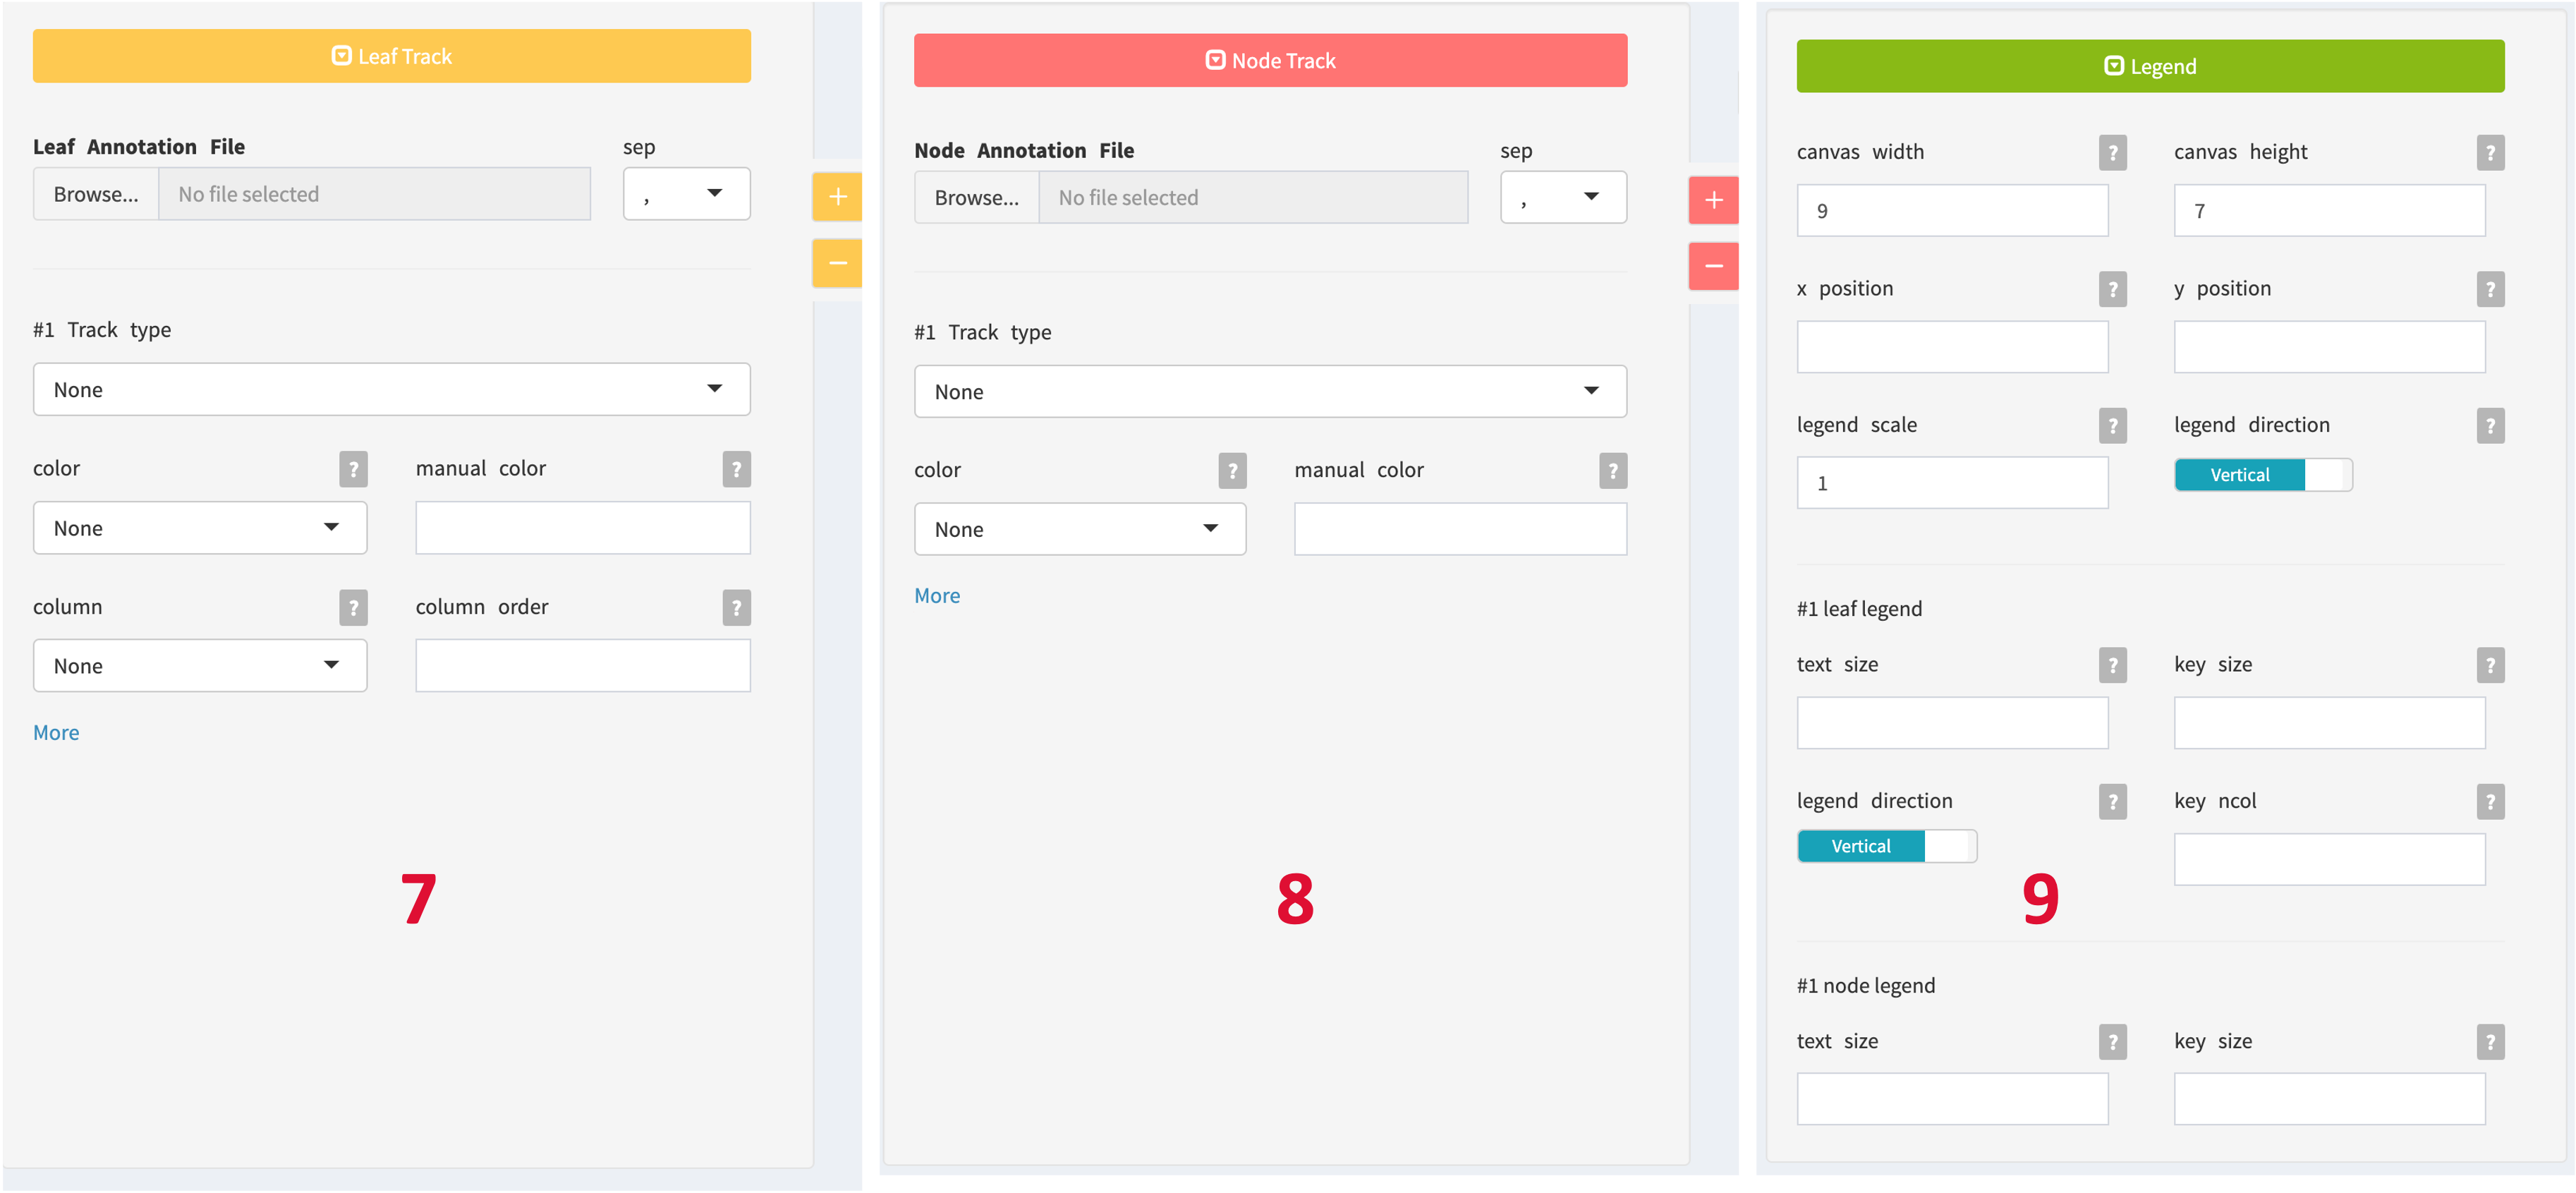
- Leaf Annotation: Use these controls to assign annotation to the external tree nodes. Click the toggle button to collapse or expand the Leaf Annotation section. Click the plus (+) and minus (-) buttons of Leaf Annotation to add or remove annotation tracks.
- Node Annotation: Use these controls to assign annotation to the internal tree nodes. Click the toggle button to collapse or expand the Node Annotation section. Click the plus (+) and minus (-) buttons of Node Annotation to add or remove annotation tracks.
- Legend Control: This control panel allows you to adjust the canvas size and legends for each annotation layer.
9.2 Inspection
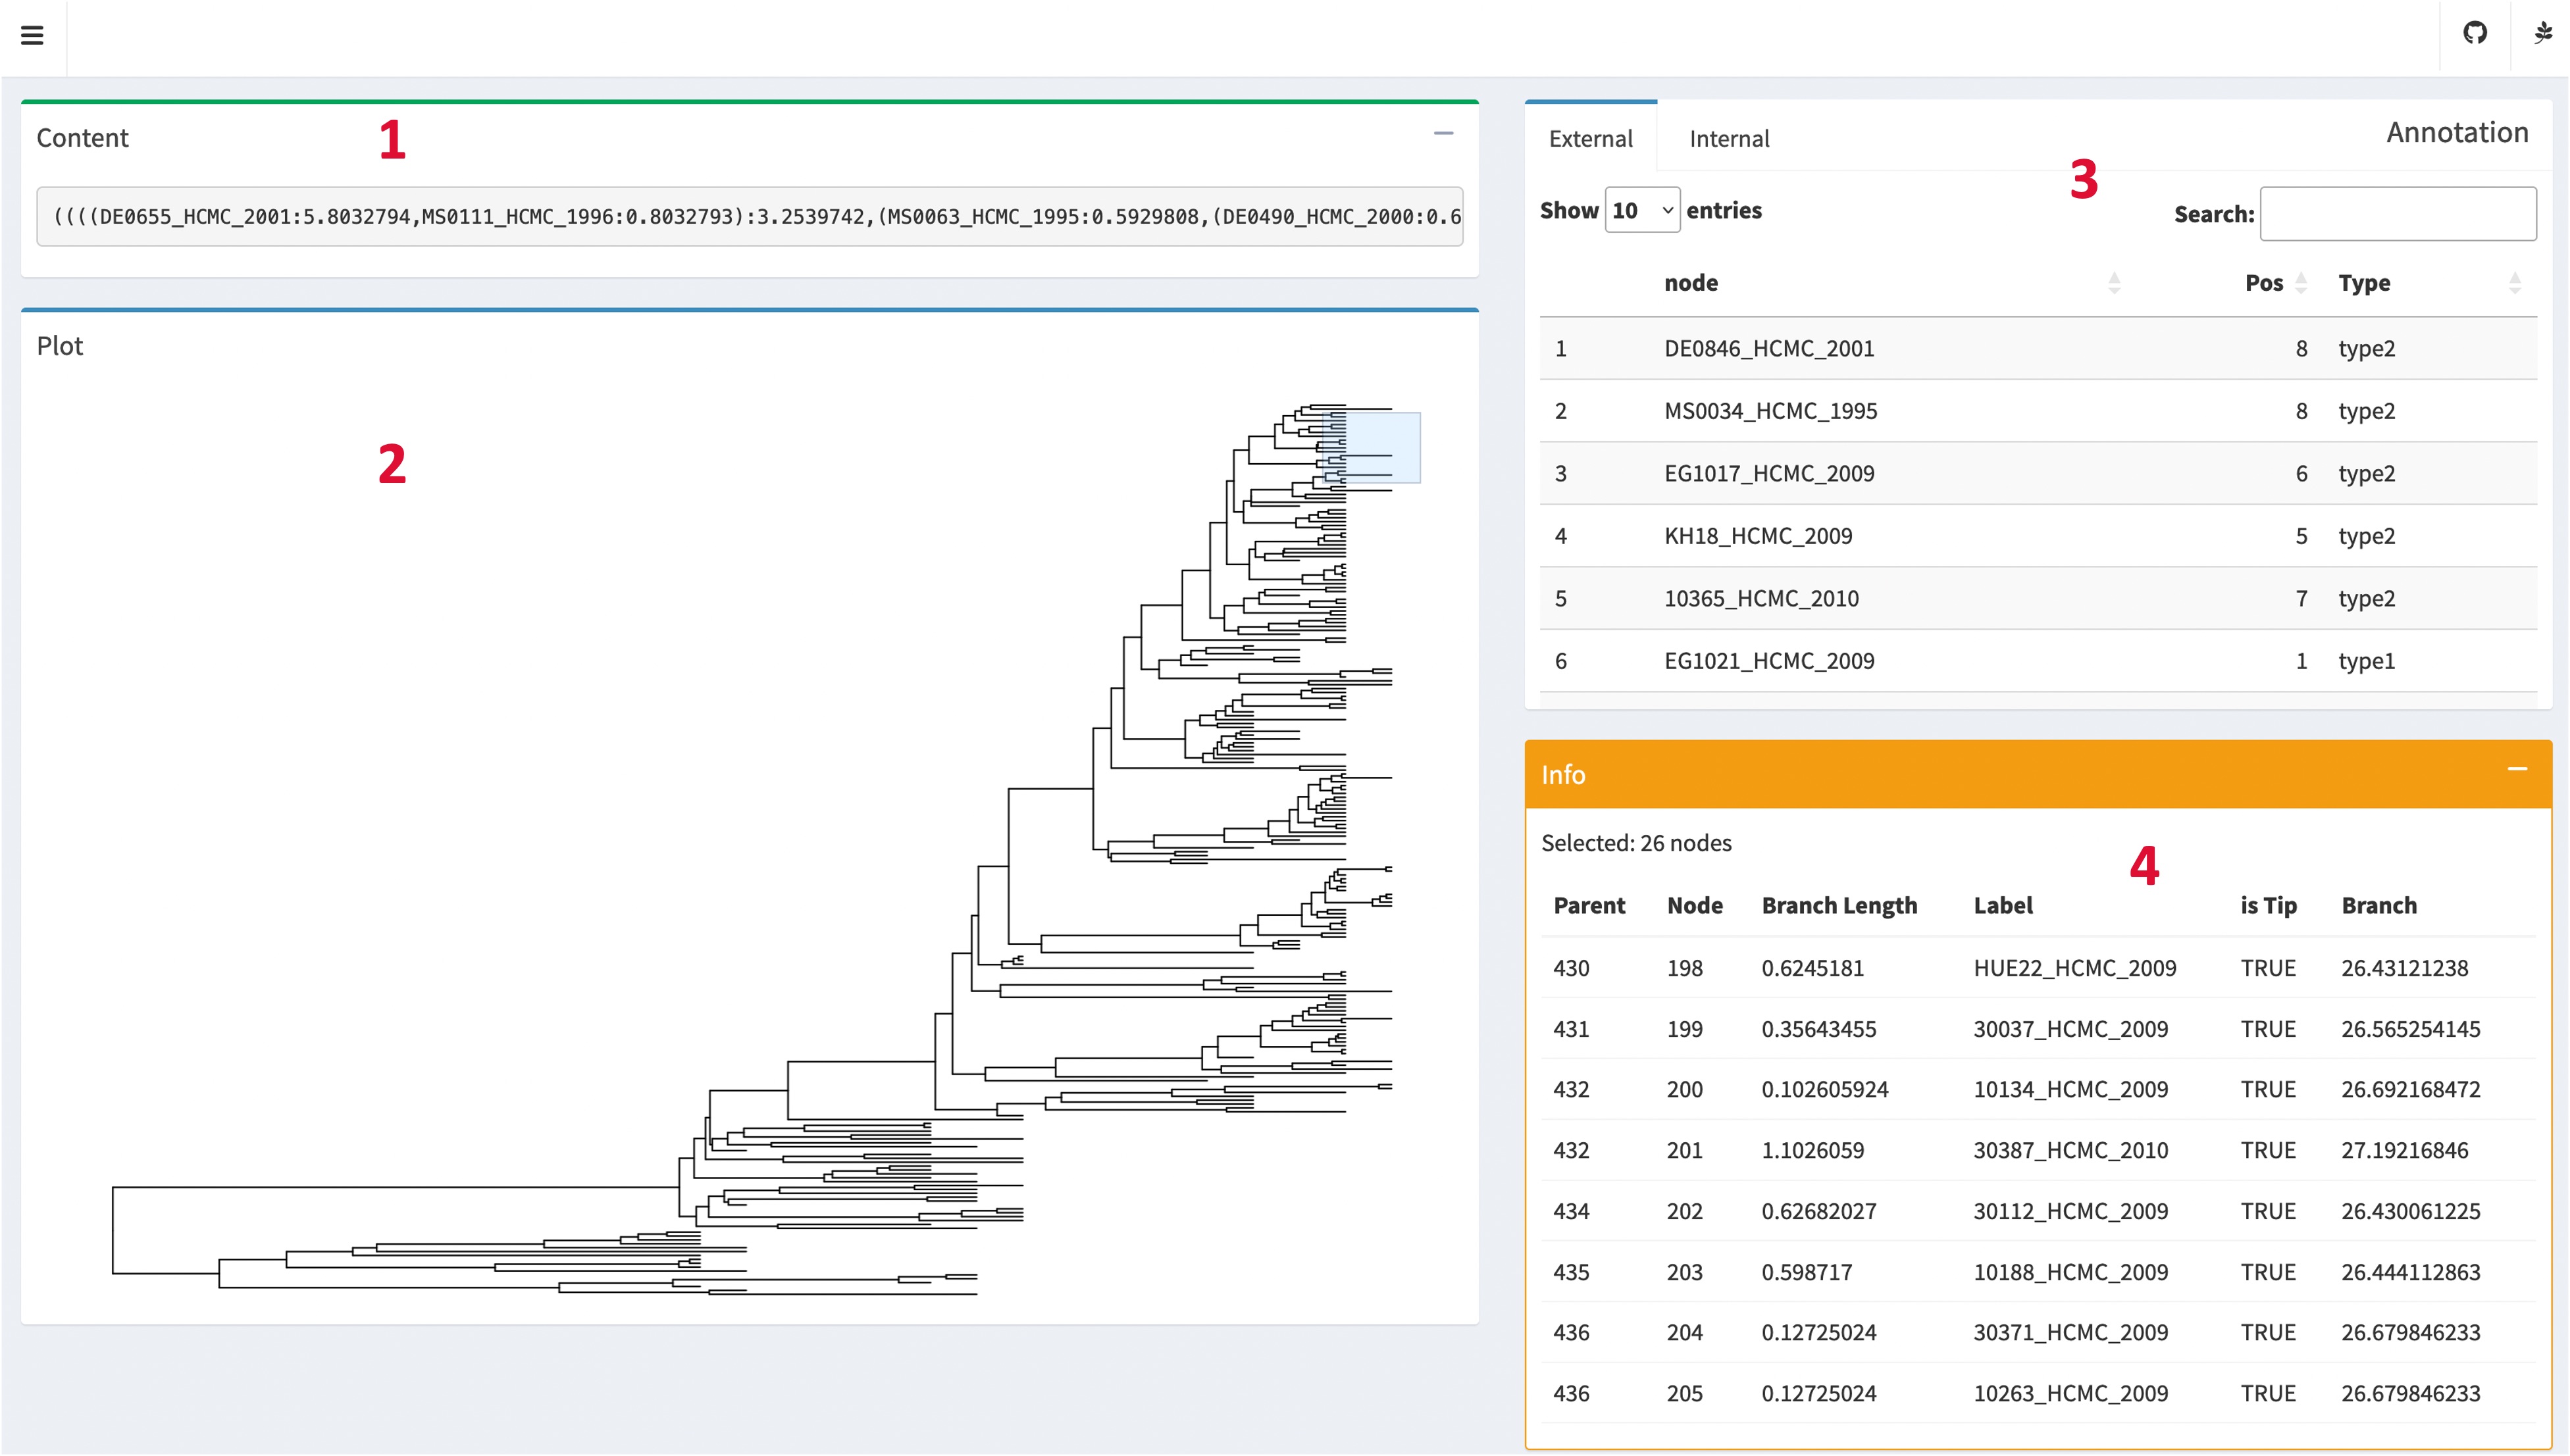
The Inspection page allows users to explore the details of the tree structure and topology, as well as view the uploaded annotation files using an interactive online table.
- Content Box: The Content Box displays the uploaded tree file in its original format. This component provides a convenient way to examine the raw tree data.
- Plot Box: The Plot Box visually represents the rectangular topology of the tree.
- Annotation Box: The Annotation Box presents user-uploaded annotation files in a tabular format. The Annotation Box supports pagination and search functionality, enabling users to navigate through large datasets and easily locate specific annotations of interest.
- Info Box: The Info Box displays information about the nodes. When users perform a selection by dragging the mouse cursor on the Plot Box, the Info Box updates to show details such as node labels, branch lengths, parent’s ID and other additional information associated with the selected nodes.
9.3 Help
The help page aims to provide a comprehensive introduction to the key features and workflow of our website. We kindly request that you contact us if you have any inquiries or require assistance.
9.4 Gallery and demo
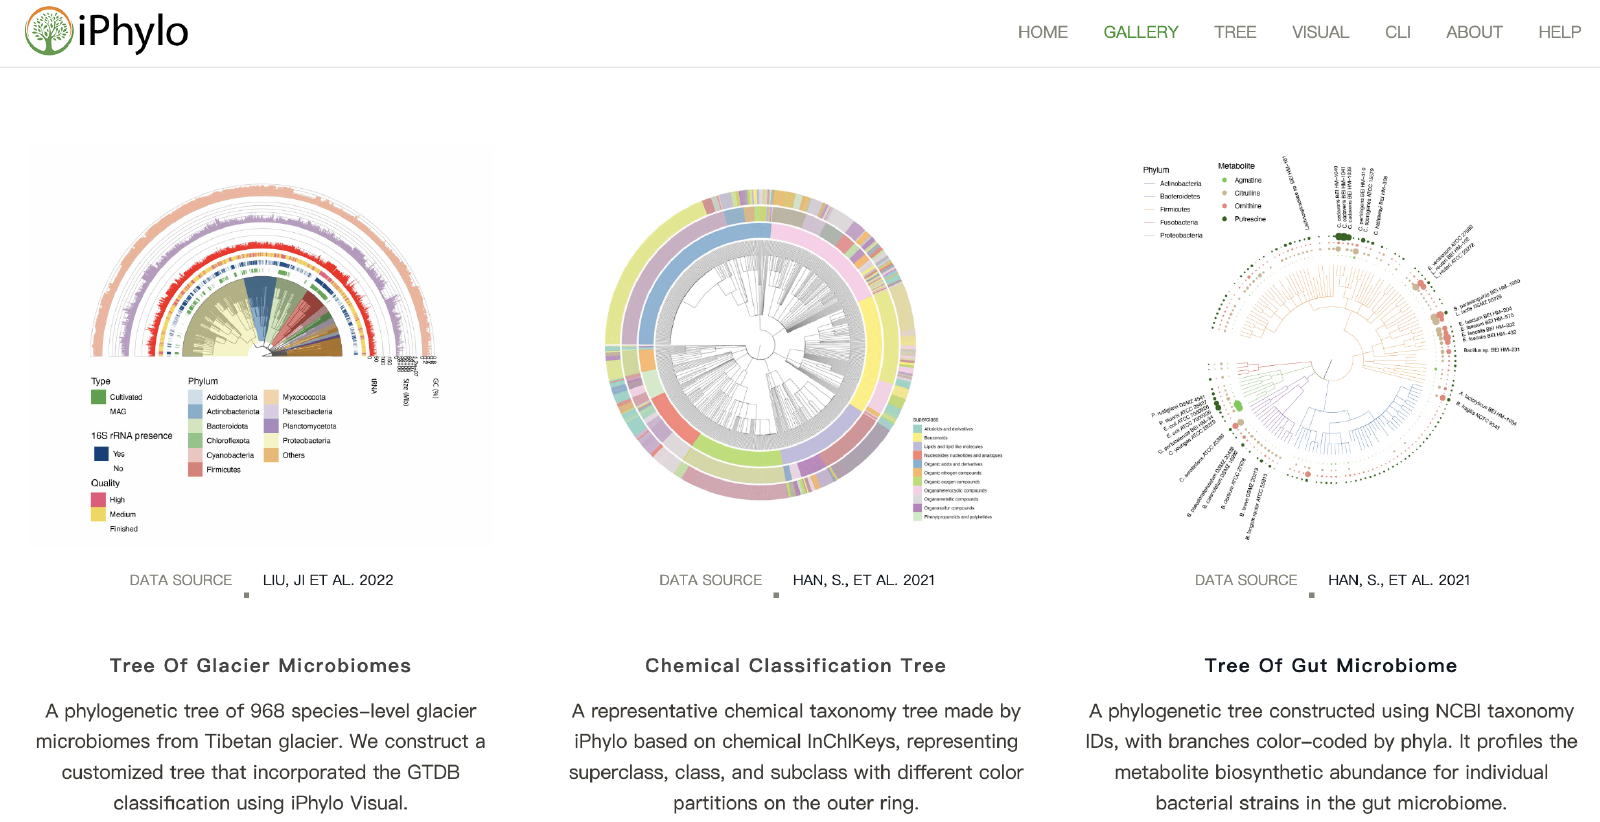
Gallery provides 5 beautiful trees drawn using iPhylo Visual, including:
Visualization of metabolic profiles for individual bacterial strains in the gut microbiome
Visualization of the genome catalog of diverse bacterial strains from a glacial microbiome dataset
Heatmap showing the taxonomy of microbes and their metabolite accumulation/consumption abundance
A representative chemical taxonomy tree generated based on chemical InChIKeys and annotated at the superclass, class, and subclass levels
A tree of common statistical methods was visualized as an example.
You can directly click ‘Try’ to draw and further adjust.