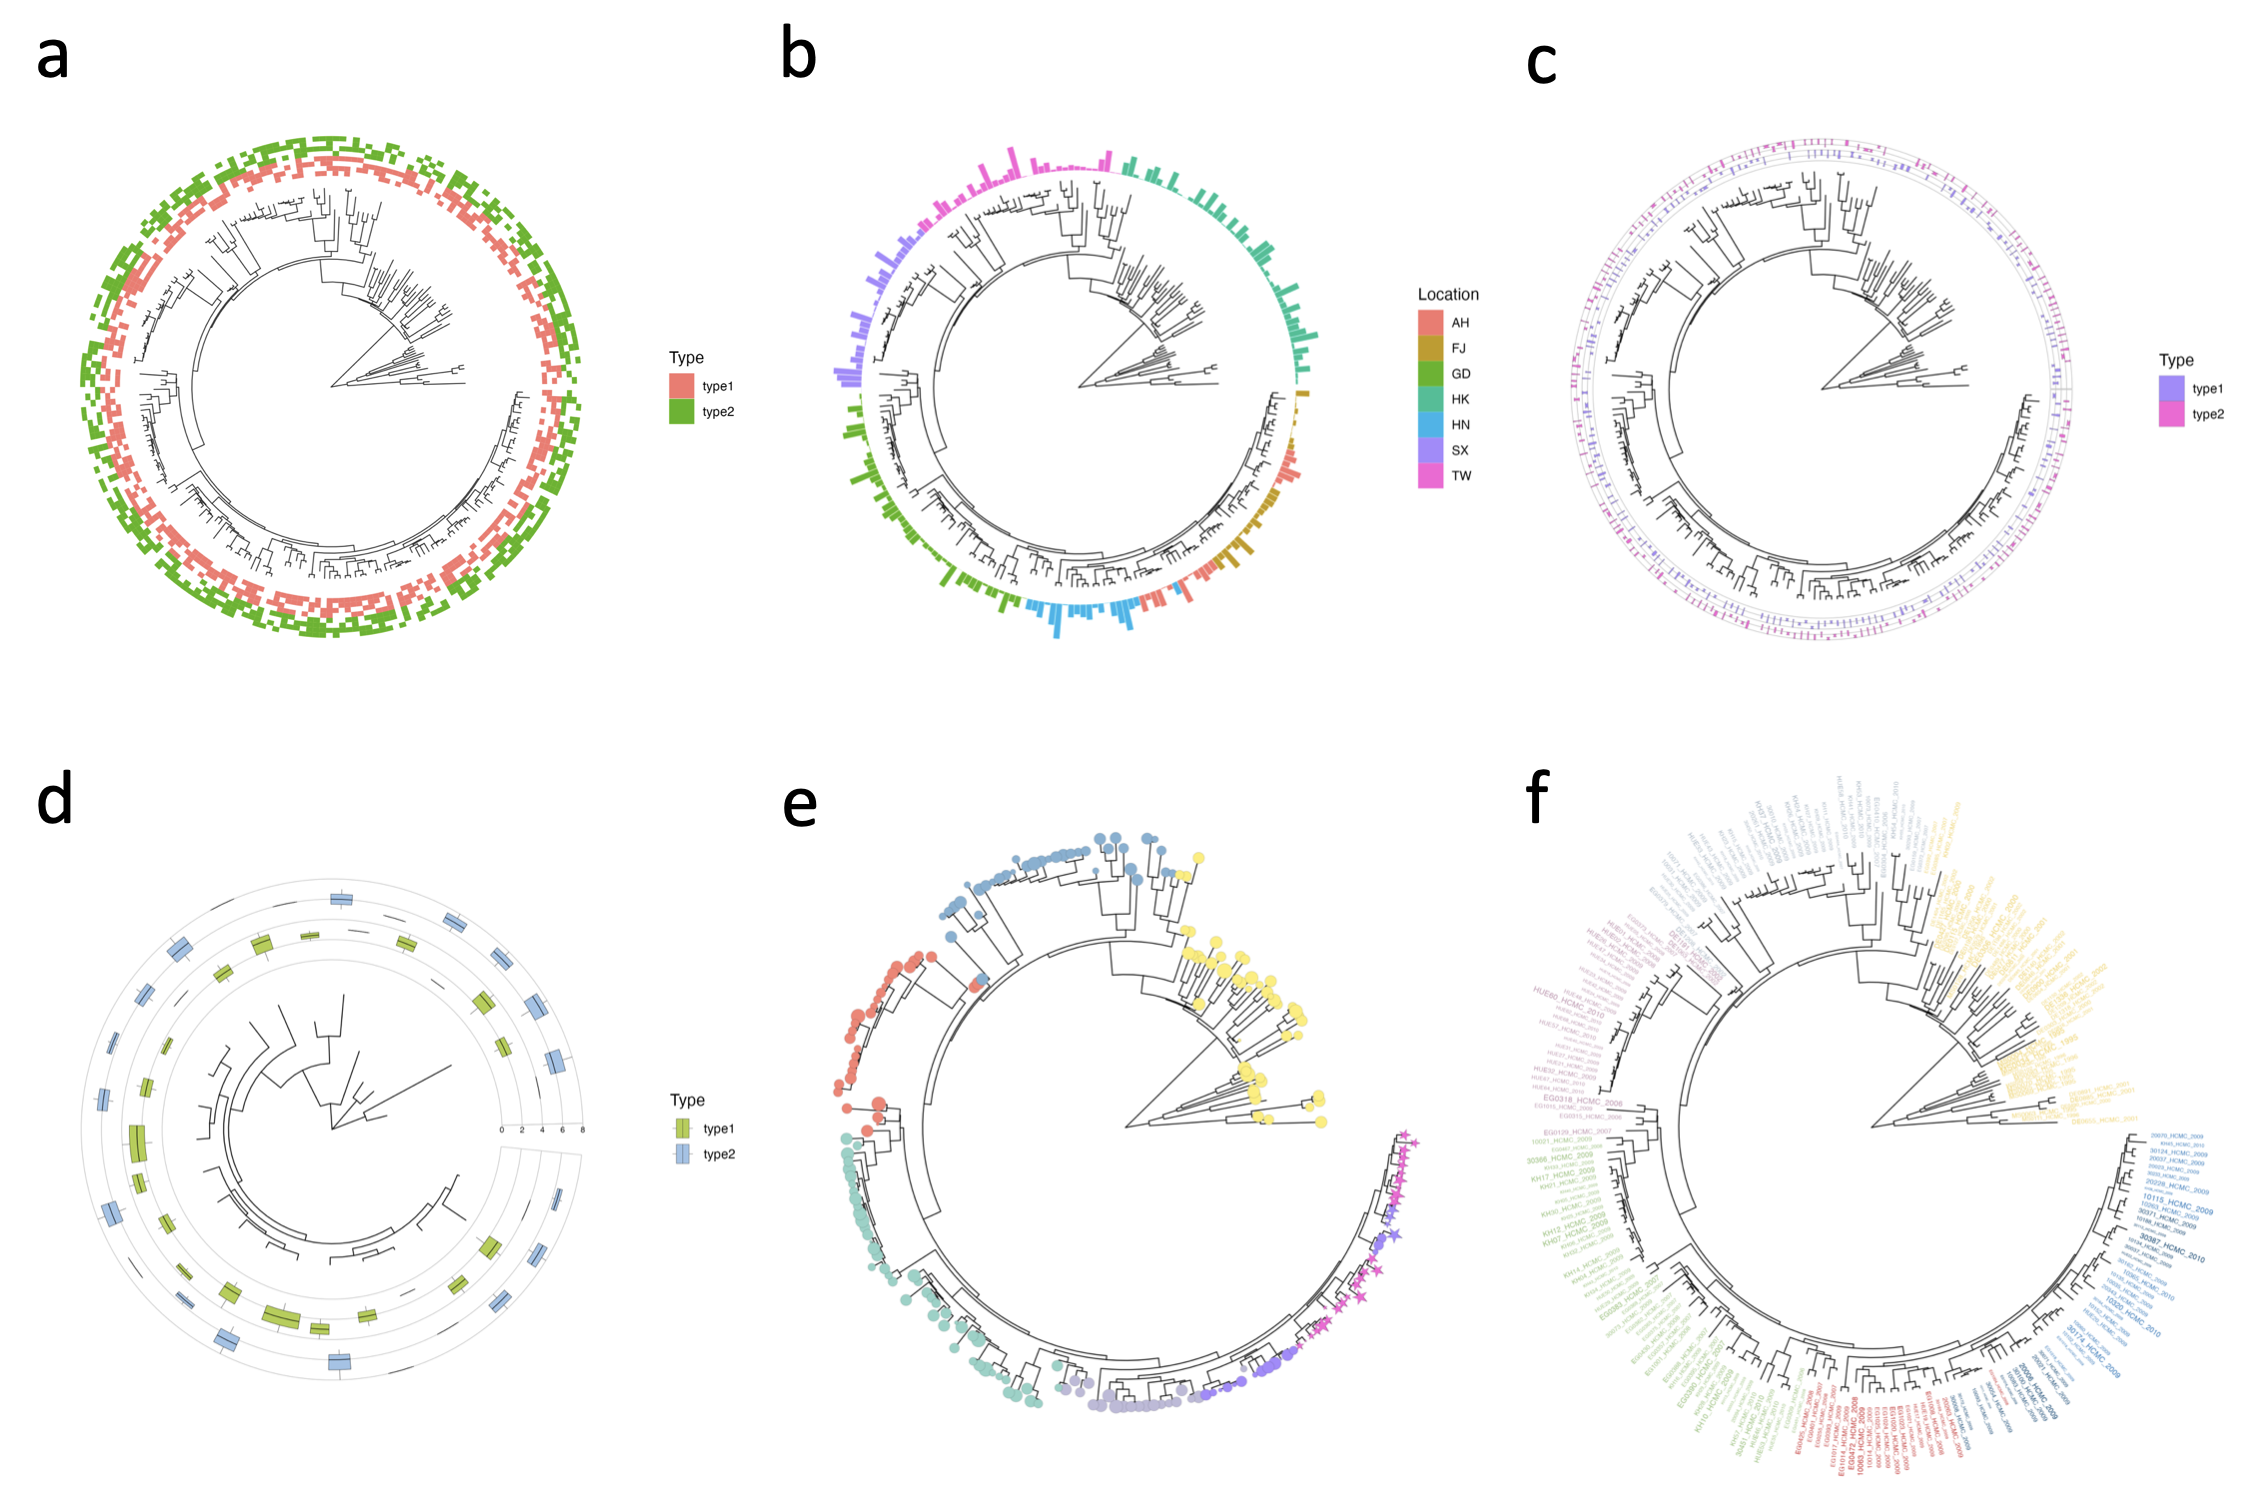
12 Leaf annotation
The “Leaf Annotation” tab manages the annotation tracks for tree leaves, encompassing bars, tiles, boxes, violins, tip points, and tip labels.
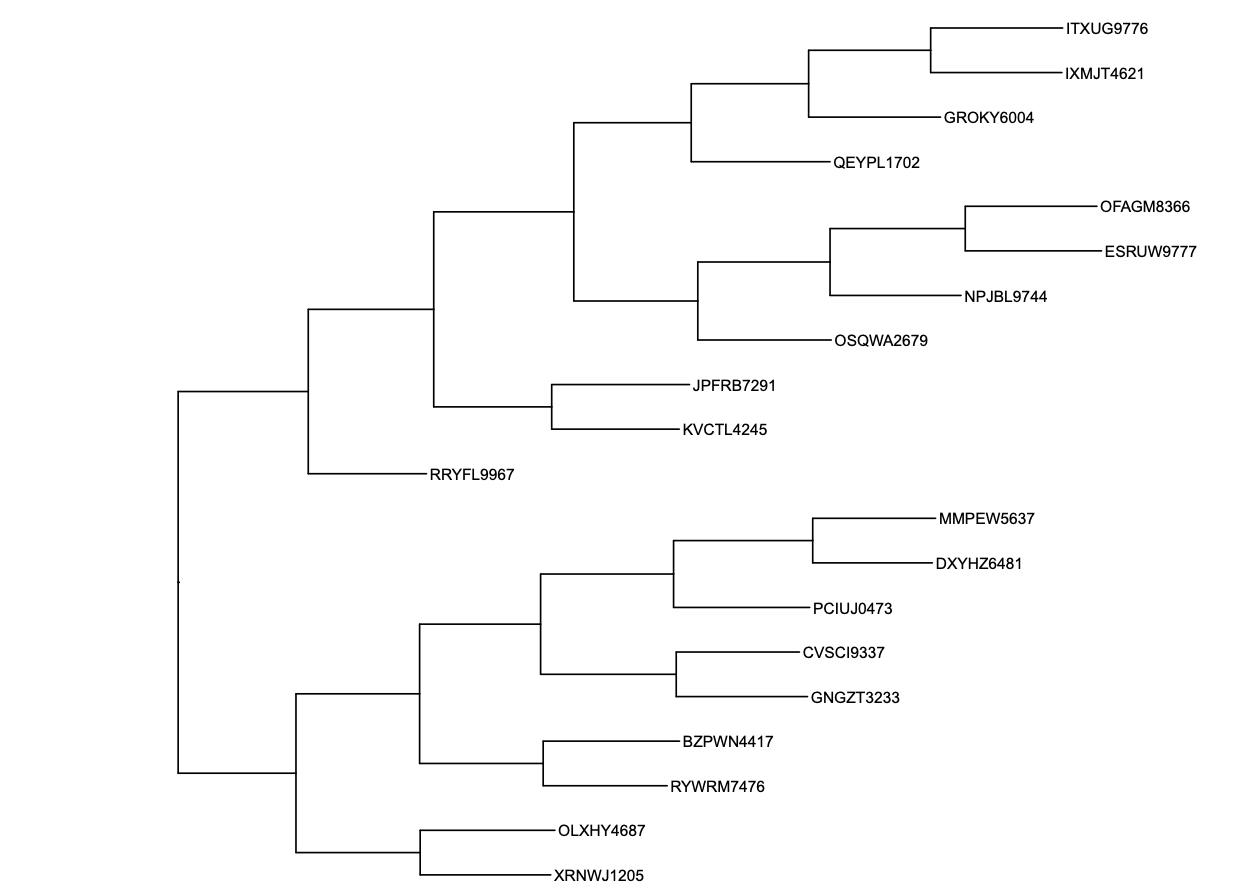
12.1 Tip label
Specifying the track type of leaf as ‘tip label’ enables showing tip labels:
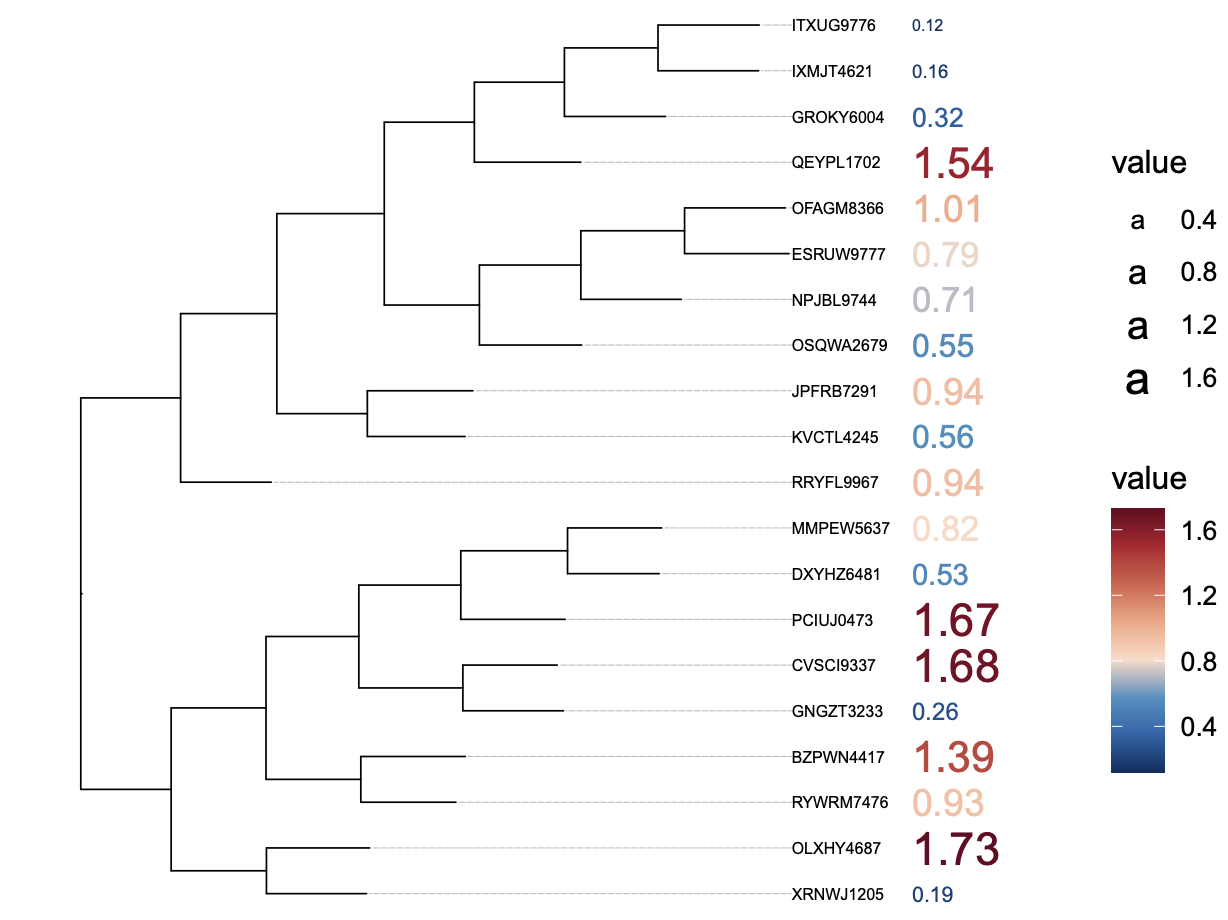
We can also modify the styles of tip labels:
Prepare the leaf annotation file:
Choose ‘label’ as the column name containing the labels we want to map.
Choose ‘color’ as the column name containing the labels we want to map. If the values are continuous, it will draw a gradient of colors.
Choose ‘size’ as the continuous variable for the label size.
Example data:
| id | value |
|---|---|
| OSQWA2679 | 0.55 |
| ESRUW9777 | 0.79 |
| OFAGM8366 | 1.01 |
| NPJBL9744 | 0.71 |
| IXMJT4621 | 0.16 |
| ITXUG9776 | 0.12 |
| GROKY6004 | 0.32 |
| QEYPL1702 | 1.54 |
| KVCTL4245 | 0.56 |
| JPFRB7291 | 0.94 |
| RRYFL9967 | 0.94 |
| XRNWJ1205 | 0.19 |
| OLXHY4687 | 1.73 |
| RYWRM7476 | 0.93 |
| BZPWN4417 | 1.39 |
| DXYHZ6481 | 0.53 |
| MMPEW5637 | 0.82 |
| PCIUJ0473 | 1.67 |
| GNGZT3233 | 0.26 |
| CVSCI9337 | 1.68 |
Other parameters:
Manual color: Allows users to manually specify colors for different categories or values.
Manual size: Allows users to manually specify size of points for different values.
Offset: Specifies the offset for the plot.
Legend: Controls the display of the legend for the plot.
Line type: Sets the line type if align is TRUE.
Line size: Adjusts the width of the line if align is TRUE.
Align: Specifies whether to align all labels.
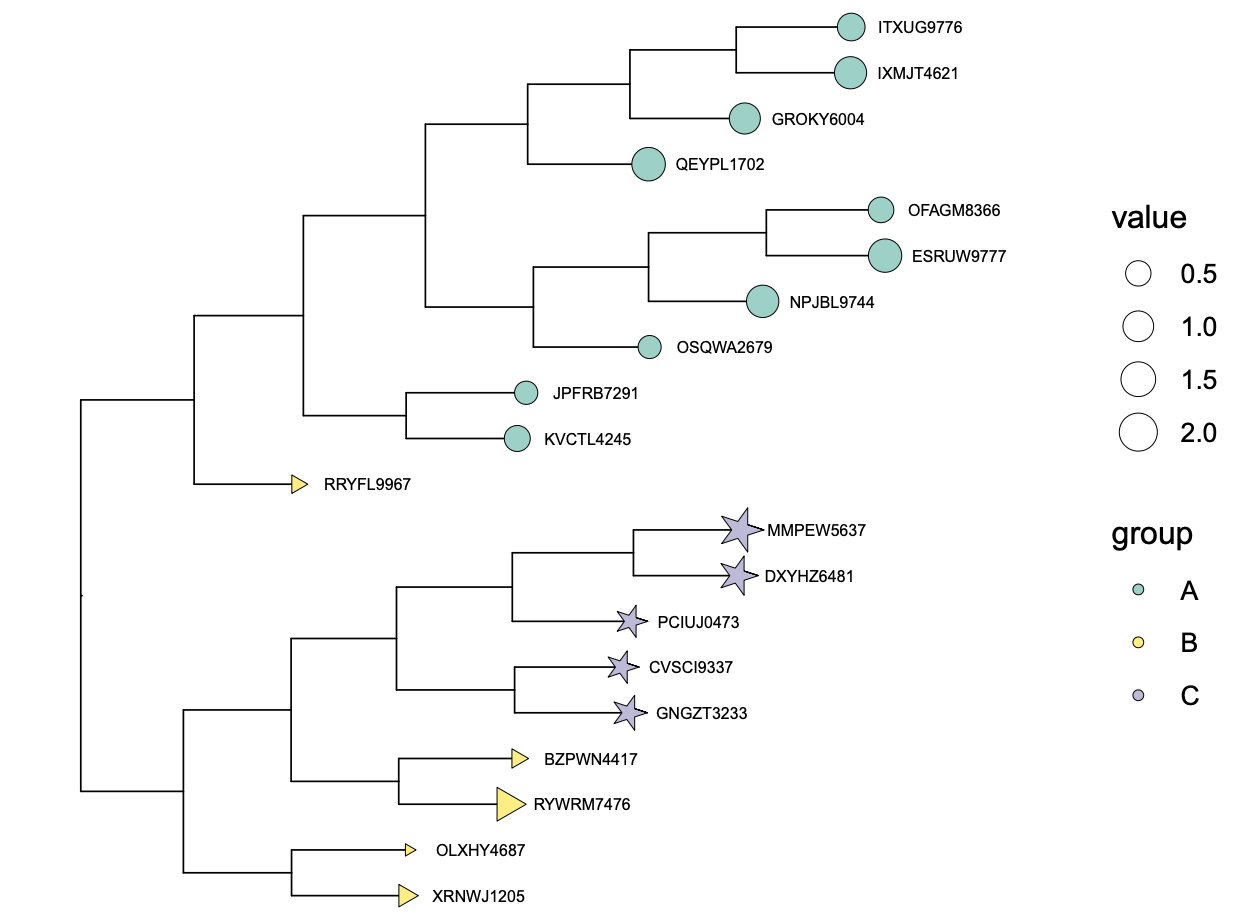
12.2 Tip point
Specifying the track type of leaf as ‘tip point’ enables the drawing of points at tips:
Prepare the leaf annotation file:
Choose ‘color’ as the column name containing the values we want to map. If the values are continuous, it will draw a gradient of colors.
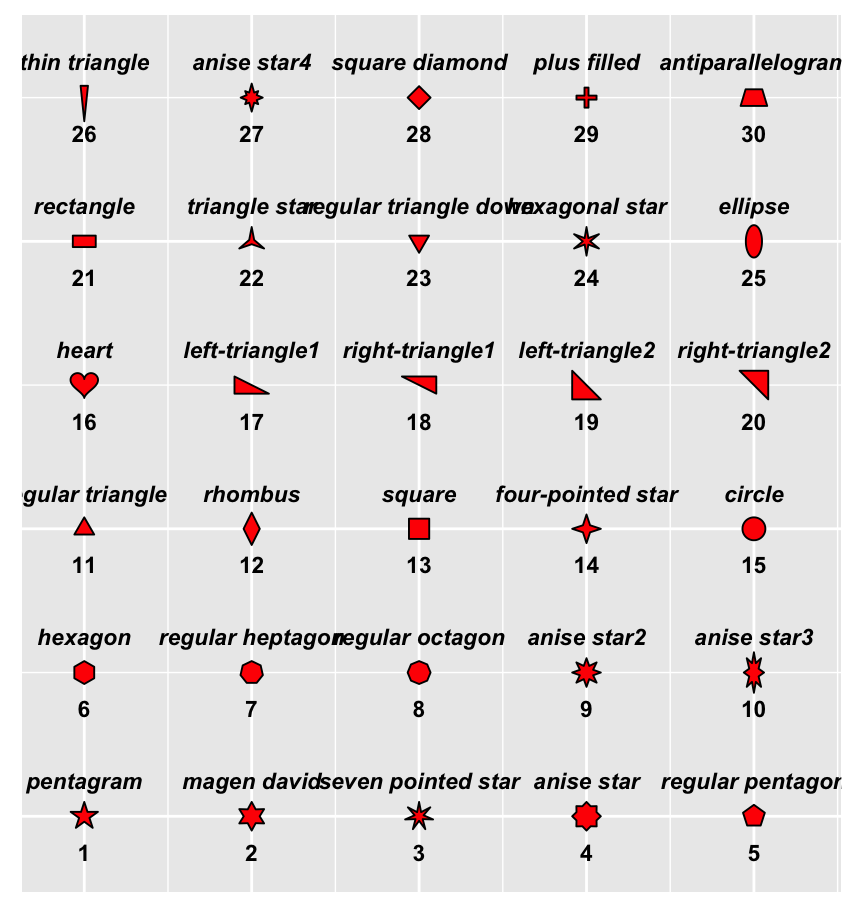
Choose ‘shape’ as the categorical variable (group) for the points.
Choose ‘size’ as the continuous variable for the points.
Example data:
| id | group | value |
|---|---|---|
| OSQWA2679 | A | 0.3454520 |
| ESRUW9777 | A | 1.3195295 |
| OFAGM8366 | A | 0.5200337 |
| NPJBL9744 | A | 1.1939274 |
| IXMJT4621 | A | 1.1706463 |
| ITXUG9776 | A | 0.6910996 |
| GROKY6004 | A | 1.0380695 |
| QEYPL1702 | A | 1.3366934 |
| KVCTL4245 | A | 0.5482420 |
| JPFRB7291 | A | 0.3555761 |
| RRYFL9967 | B | 0.2518943 |
| XRNWJ1205 | B | 0.5427021 |
| OLXHY4687 | B | 0.0797344 |
| RYWRM7476 | B | 2.1533550 |
| BZPWN4417 | B | 0.3020899 |
| DXYHZ6481 | C | 1.2910100 |
| MMPEW5637 | C | 1.8894510 |
| PCIUJ0473 | C | 0.6348867 |
| GNGZT3233 | C | 0.8754801 |
| CVSCI9337 | C | 0.6716307 |
Other parameters:
Manual color: Allows users to manually specify colors for different categories or values.
Column order: Determines the order in which columns are displayed in the plot.
Manual size: Allows users to manually specify size of points for different values.
Offset: Specifies the offset for the plot.
Legend: Controls the display of the legend for the plot.
Border color: Sets the color of the borders around plot tiles.
Border width: Adjusts the width of the borders around plot tiles.
Manual shape: Allows users to manually specify shape of points for different categories.
Track height: Defines the height of the entire track.
Alpha: Sets the transparency level for the plot.
Grid: Enables or disables the grid lines in the plot.
Axis: Specifies whether to display axes for the plot.
Font size: Adjusts the size of the font used for labels.
Label angle: Sets the angle of the labels in the plot.
Label align: Controls the alignment of labels in the plot (e.g., top, bottom, center).
Align: Specifies whether to align all points.
12.3 Heatmap
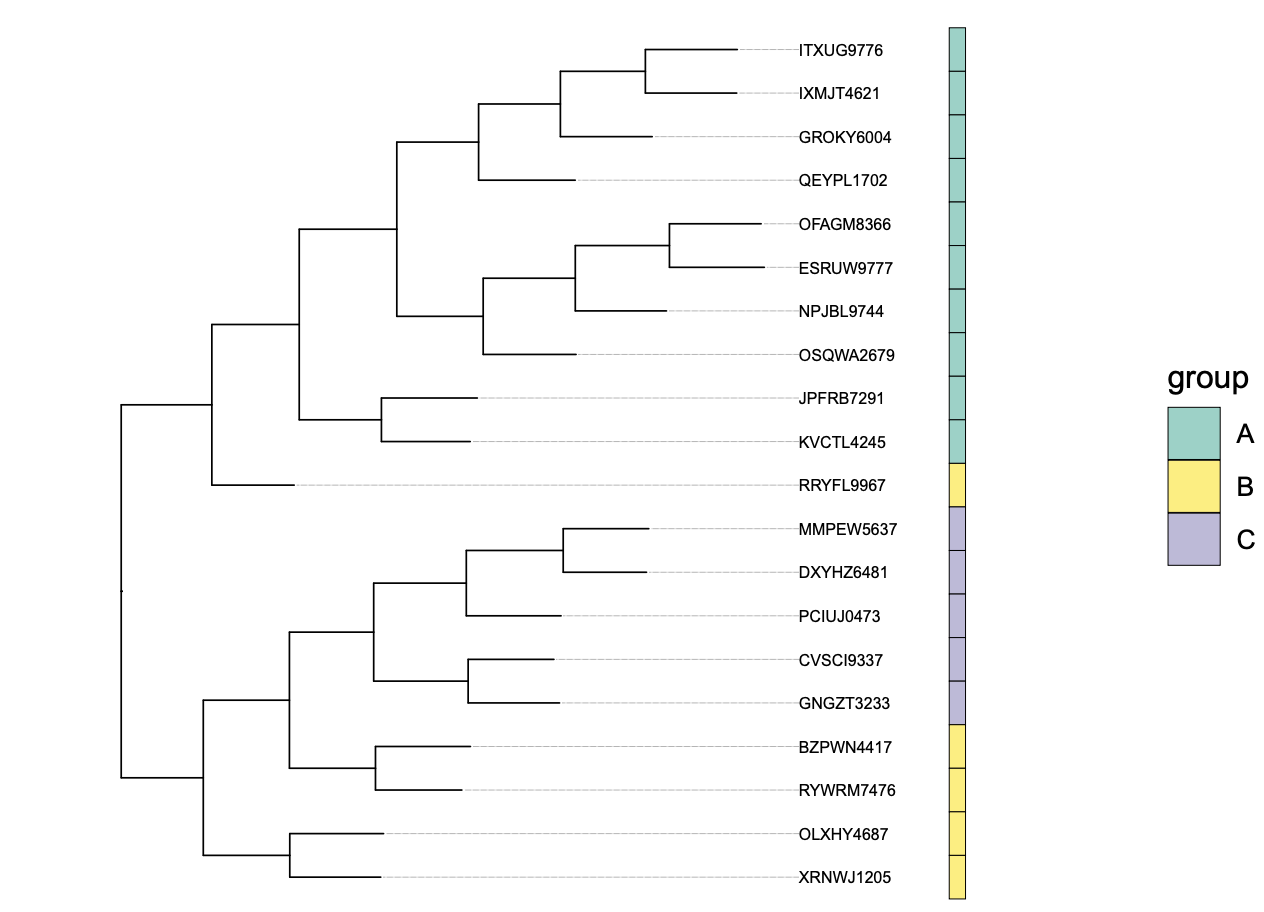
Specifying the track type of leaf as ‘tile’ enables the drawing of a heatmap:
Prepare the leaf annotation file:
Choose ‘color’ as the column name containing the values we want to map.
If the values are categorical, it will draw grouped color blocks.
Example data:
| id | group |
|---|---|
| OSQWA2679 | A |
| ESRUW9777 | A |
| OFAGM8366 | A |
| NPJBL9744 | A |
| IXMJT4621 | A |
| ITXUG9776 | A |
| GROKY6004 | A |
| QEYPL1702 | A |
| KVCTL4245 | A |
| JPFRB7291 | A |
| RRYFL9967 | B |
| XRNWJ1205 | B |
| OLXHY4687 | B |
| RYWRM7476 | B |
| BZPWN4417 | B |
| DXYHZ6481 | C |
| MMPEW5637 | C |
| PCIUJ0473 | C |
| GNGZT3233 | C |
| CVSCI9337 | C |
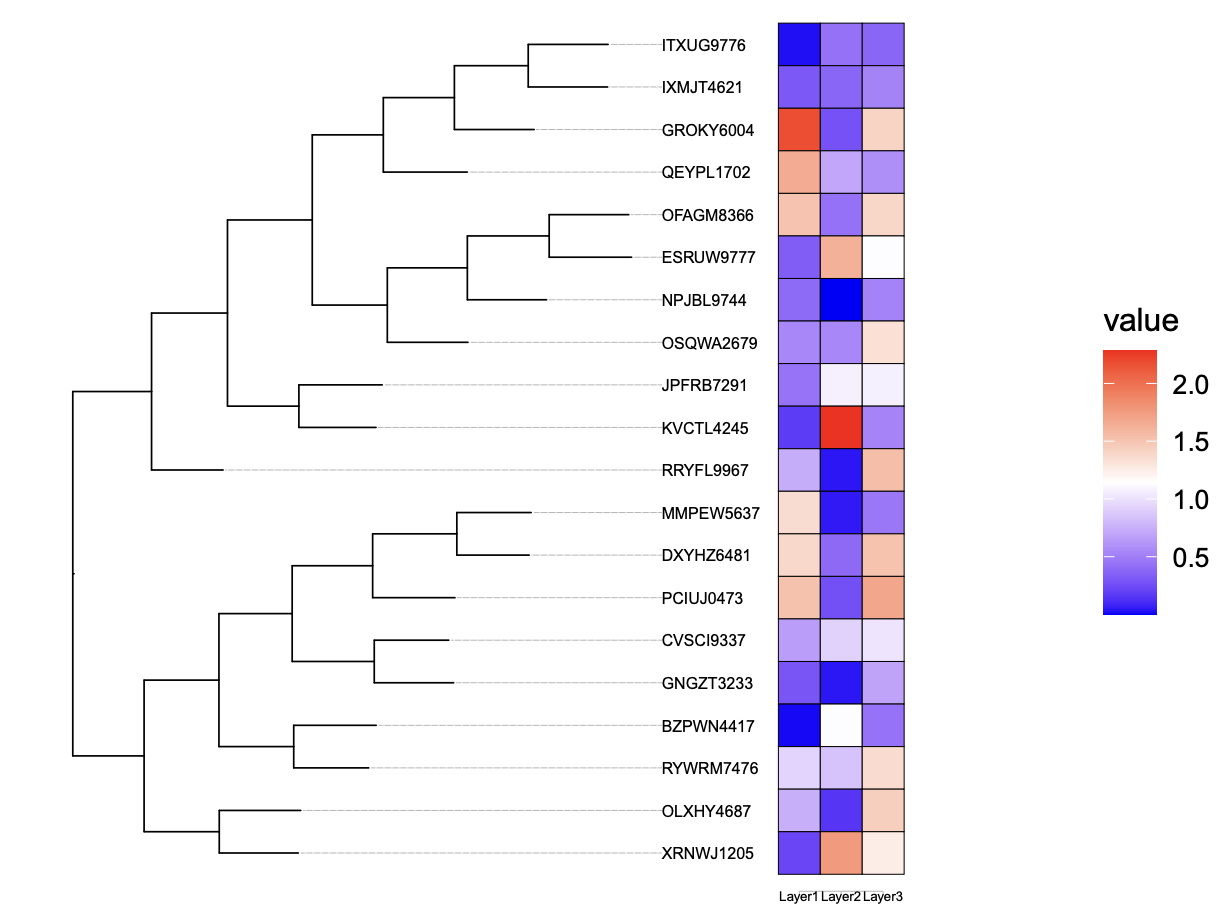
If the values are continuous, it will draw a gradient of colors.
Choose ‘column’ as the categorical variable (layer) for the heatmap, making it easy to draw multiple columns of heatmaps.
Example data:
| id | layer | value |
|---|---|---|
| OSQWA2679 | Layer1 | 0.55 |
| ESRUW9777 | Layer1 | 0.79 |
| OFAGM8366 | Layer1 | 1.01 |
| NPJBL9744 | Layer1 | 0.71 |
| IXMJT4621 | Layer1 | 0.16 |
| ITXUG9776 | Layer1 | 0.12 |
| GROKY6004 | Layer1 | 0.32 |
| QEYPL1702 | Layer1 | 1.54 |
| KVCTL4245 | Layer1 | 0.56 |
| JPFRB7291 | Layer1 | 0.94 |
| RRYFL9967 | Layer1 | 0.94 |
| XRNWJ1205 | Layer1 | 0.19 |
| OLXHY4687 | Layer1 | 1.73 |
| RYWRM7476 | Layer1 | 0.93 |
| BZPWN4417 | Layer1 | 1.39 |
| DXYHZ6481 | Layer1 | 0.53 |
| MMPEW5637 | Layer1 | 0.82 |
| PCIUJ0473 | Layer1 | 1.67 |
| GNGZT3233 | Layer1 | 0.26 |
| CVSCI9337 | Layer1 | 1.68 |
| OSQWA2679 | Layer2 | 1.32 |
| ESRUW9777 | Layer2 | 1.37 |
| OFAGM8366 | Layer2 | 0.36 |
| NPJBL9744 | Layer2 | 0.61 |
| IXMJT4621 | Layer2 | 0.49 |
| ITXUG9776 | Layer2 | 0.18 |
| GROKY6004 | Layer2 | 0.27 |
| QEYPL1702 | Layer2 | 0.49 |
| KVCTL4245 | Layer2 | 0.16 |
| JPFRB7291 | Layer2 | 0.65 |
| RRYFL9967 | Layer2 | 1.16 |
| XRNWJ1205 | Layer2 | 0.59 |
| OLXHY4687 | Layer2 | 0.17 |
| RYWRM7476 | Layer2 | 0.62 |
| BZPWN4417 | Layer2 | 0.02 |
| DXYHZ6481 | Layer2 | 1.35 |
| MMPEW5637 | Layer2 | 0.22 |
| PCIUJ0473 | Layer2 | 1.43 |
| GNGZT3233 | Layer2 | 1.80 |
| CVSCI9337 | Layer2 | 1.83 |
| OSQWA2679 | Layer3 | 0.71 |
| ESRUW9777 | Layer3 | 1.83 |
| OFAGM8366 | Layer3 | 0.76 |
| NPJBL9744 | Layer3 | 0.80 |
| IXMJT4621 | Layer3 | 0.53 |
| ITXUG9776 | Layer3 | 0.94 |
| GROKY6004 | Layer3 | 0.40 |
| QEYPL1702 | Layer3 | 0.77 |
| KVCTL4245 | Layer3 | 0.03 |
| JPFRB7291 | Layer3 | 0.81 |
| RRYFL9967 | Layer3 | 0.17 |
| XRNWJ1205 | Layer3 | 1.36 |
| OLXHY4687 | Layer3 | 0.61 |
| RYWRM7476 | Layer3 | 1.27 |
| BZPWN4417 | Layer3 | 2.23 |
| DXYHZ6481 | Layer3 | 0.23 |
| MMPEW5637 | Layer3 | 1.14 |
| PCIUJ0473 | Layer3 | 0.09 |
| GNGZT3233 | Layer3 | 1.22 |
| CVSCI9337 | Layer3 | 0.08 |
Other parameters:
Manual color: Allows users to manually specify colors for different categories or values.
Column order: Determines the order in which columns are displayed in the heatmap.
Offset: Specifies the offset for the heatmap.
Legend: Controls the display of the legend for the heatmap.
Border color: Sets the color of the borders around heatmap tiles.
Border width: Adjusts the width of the borders around heatmap tiles.
Track height: Defines the height of the entire track.
Alpha: Sets the transparency level for the heatmap tiles.
Grid: Enables or disables the grid lines in the heatmap.
Axis: Specifies whether to display axes for the heatmap.
Font size: Adjusts the size of the font used for labels.
Label angle: Sets the angle of the labels in the heatmap.
Label align: Controls the alignment of labels in the heatmap (e.g., top, bottom, center).
12.4 Bar plot
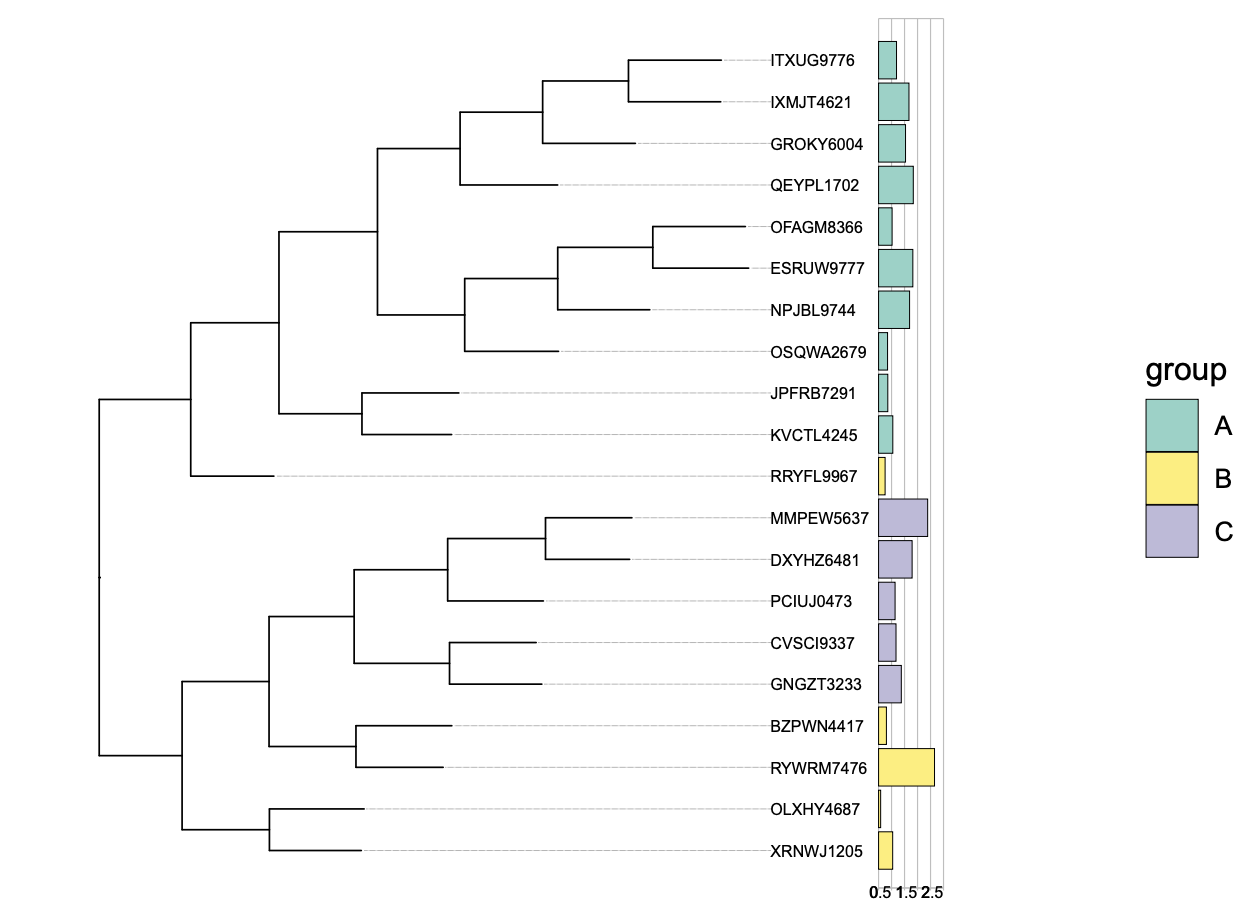
Specifying the track type of leaf as ‘bar’ enables the drawing of a bar plot:
Prepare the leaf annotation file:
Choose ‘color’ as the column name containing the values we want to map. If the values are categorical, it will draw grouped color blocks. If the values are continuous, it will draw a gradient of colors.
Choose ‘column’ as the continuous variable (value) for the bar plot, it will be the y-axis value of each leaf.
Example data:
| id | group | value |
|---|---|---|
| OSQWA2679 | A | 0.3454520 |
| ESRUW9777 | A | 1.3195295 |
| OFAGM8366 | A | 0.5200337 |
| NPJBL9744 | A | 1.1939274 |
| IXMJT4621 | A | 1.1706463 |
| ITXUG9776 | A | 0.6910996 |
| GROKY6004 | A | 1.0380695 |
| QEYPL1702 | A | 1.3366934 |
| KVCTL4245 | A | 0.5482420 |
| JPFRB7291 | A | 0.3555761 |
| RRYFL9967 | B | 0.2518943 |
| XRNWJ1205 | B | 0.5427021 |
| OLXHY4687 | B | 0.0797344 |
| RYWRM7476 | B | 2.1533550 |
| BZPWN4417 | B | 0.3020899 |
| DXYHZ6481 | C | 1.2910100 |
| MMPEW5637 | C | 1.8894510 |
| PCIUJ0473 | C | 0.6348867 |
| GNGZT3233 | C | 0.8754801 |
| CVSCI9337 | C | 0.6716307 |
Other parameters:
Manual color: Allows users to manually specify colors for different categories or values.
Column order: Determines the order in which columns are displayed in the plot.
Offset: Specifies the offset for the plot.
Legend: Controls the display of the legend for the plot.
Border color: Sets the color of the borders around plot tiles.
Border width: Adjusts the width of the borders around plot tiles.
Track height: Defines the height of the entire track.
Alpha: Sets the transparency level for the plot.
Grid: Enables or disables the grid lines in the plot.
Axis: Specifies whether to display axes for the plot.
Font size: Adjusts the size of the font used for labels.
Label angle: Sets the angle of the labels in the plot.
Label align: Controls the alignment of labels in the plot (e.g., top, bottom, center).
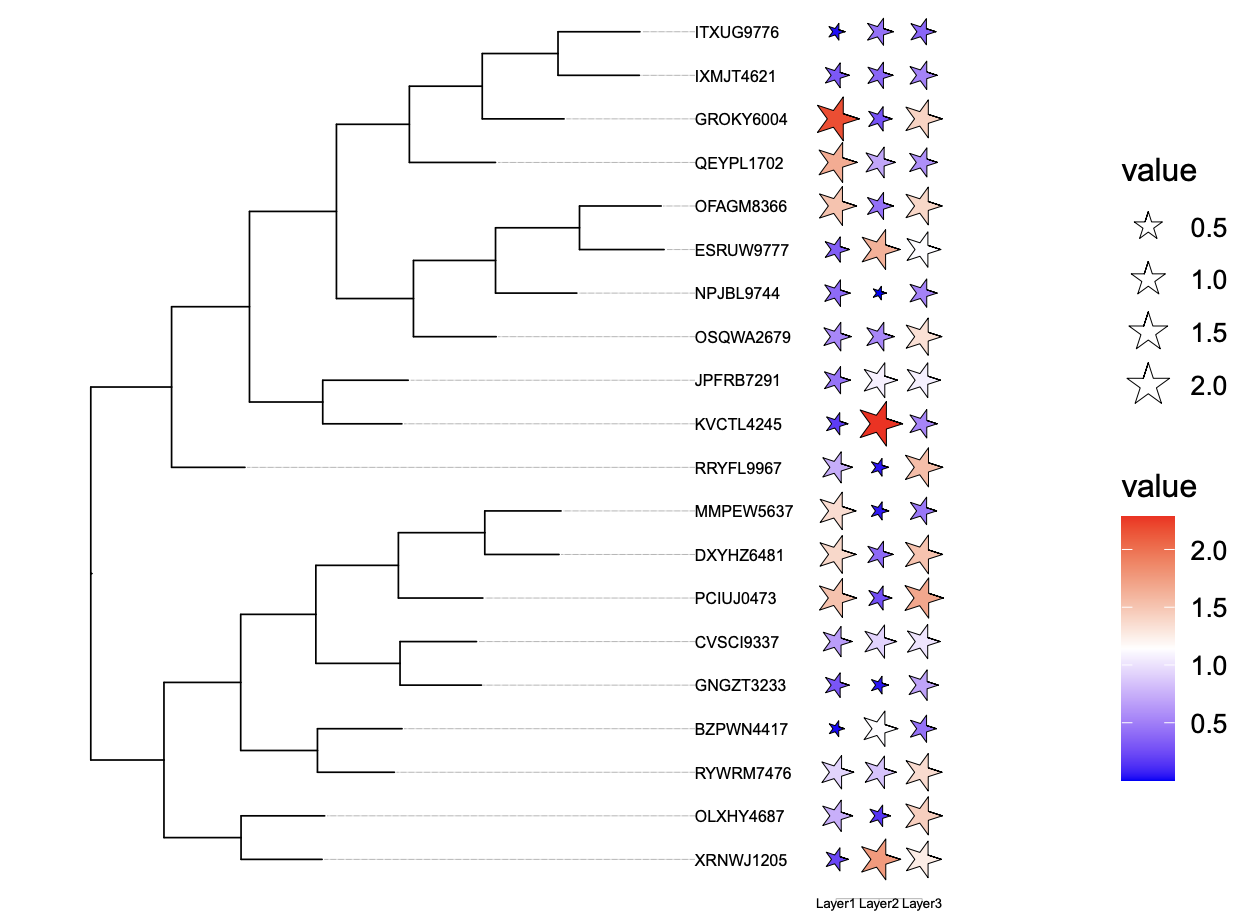
12.5 Bubble plot
Specifying the track type of leaf as ‘tip point’ enables the drawing of a bubble plot:
Prepare the leaf annotation file:
Choose ‘color’ as the column name containing the values we want to map. If the values are continuous, it will draw a gradient of colors.
Choose ‘column’ as the categorical variable (layer) for the bubble plot, making it easy to draw multiple columns of bubble plot.
Choose ‘column’ as the categorical variable (layer) for the bubble plot, making it easy to draw multiple columns of bubble plot.
Choose ‘size’ as the continuous variable for the bubble plot.
Example data:
| id | layer | value |
|---|---|---|
| OSQWA2679 | Layer1 | 0.55 |
| ESRUW9777 | Layer1 | 0.79 |
| OFAGM8366 | Layer1 | 1.01 |
| NPJBL9744 | Layer1 | 0.71 |
| IXMJT4621 | Layer1 | 0.16 |
| ITXUG9776 | Layer1 | 0.12 |
| GROKY6004 | Layer1 | 0.32 |
| QEYPL1702 | Layer1 | 1.54 |
| KVCTL4245 | Layer1 | 0.56 |
| JPFRB7291 | Layer1 | 0.94 |
| RRYFL9967 | Layer1 | 0.94 |
| XRNWJ1205 | Layer1 | 0.19 |
| OLXHY4687 | Layer1 | 1.73 |
| RYWRM7476 | Layer1 | 0.93 |
| BZPWN4417 | Layer1 | 1.39 |
| DXYHZ6481 | Layer1 | 0.53 |
| MMPEW5637 | Layer1 | 0.82 |
| PCIUJ0473 | Layer1 | 1.67 |
| GNGZT3233 | Layer1 | 0.26 |
| CVSCI9337 | Layer1 | 1.68 |
| OSQWA2679 | Layer2 | 1.32 |
| ESRUW9777 | Layer2 | 1.37 |
| OFAGM8366 | Layer2 | 0.36 |
| NPJBL9744 | Layer2 | 0.61 |
| IXMJT4621 | Layer2 | 0.49 |
| ITXUG9776 | Layer2 | 0.18 |
| GROKY6004 | Layer2 | 0.27 |
| QEYPL1702 | Layer2 | 0.49 |
| KVCTL4245 | Layer2 | 0.16 |
| JPFRB7291 | Layer2 | 0.65 |
| RRYFL9967 | Layer2 | 1.16 |
| XRNWJ1205 | Layer2 | 0.59 |
| OLXHY4687 | Layer2 | 0.17 |
| RYWRM7476 | Layer2 | 0.62 |
| BZPWN4417 | Layer2 | 0.02 |
| DXYHZ6481 | Layer2 | 1.35 |
| MMPEW5637 | Layer2 | 0.22 |
| PCIUJ0473 | Layer2 | 1.43 |
| GNGZT3233 | Layer2 | 1.80 |
| CVSCI9337 | Layer2 | 1.83 |
| OSQWA2679 | Layer3 | 0.71 |
| ESRUW9777 | Layer3 | 1.83 |
| OFAGM8366 | Layer3 | 0.76 |
| NPJBL9744 | Layer3 | 0.80 |
| IXMJT4621 | Layer3 | 0.53 |
| ITXUG9776 | Layer3 | 0.94 |
| GROKY6004 | Layer3 | 0.40 |
| QEYPL1702 | Layer3 | 0.77 |
| KVCTL4245 | Layer3 | 0.03 |
| JPFRB7291 | Layer3 | 0.81 |
| RRYFL9967 | Layer3 | 0.17 |
| XRNWJ1205 | Layer3 | 1.36 |
| OLXHY4687 | Layer3 | 0.61 |
| RYWRM7476 | Layer3 | 1.27 |
| BZPWN4417 | Layer3 | 2.23 |
| DXYHZ6481 | Layer3 | 0.23 |
| MMPEW5637 | Layer3 | 1.14 |
| PCIUJ0473 | Layer3 | 0.09 |
| GNGZT3233 | Layer3 | 1.22 |
| CVSCI9337 | Layer3 | 0.08 |
Other parameters:
Manual color: Allows users to manually specify colors for different categories or values.
Column order: Determines the order in which columns are displayed in the plot.
Manual size: Allows users to manually specify size of points for different values.
Offset: Specifies the offset for the plot.
Legend: Controls the display of the legend for the plot.
Border color: Sets the color of the borders around plot tiles.
Border width: Adjusts the width of the borders around plot tiles.
Shape: Allows users to mapping shape of points.
Manual shape: Allows users to manually specify shape of points for different categories.
Track height: Defines the height of the entire track.
Alpha: Sets the transparency level for the plot.
Grid: Enables or disables the grid lines in the plot.
Axis: Specifies whether to display axes for the plot.
Font size: Adjusts the size of the font used for labels.
Label angle: Sets the angle of the labels in the plot.
Label align: Controls the alignment of labels in the plot (e.g., top, bottom, center).
Align: Specifies whether to align all points.
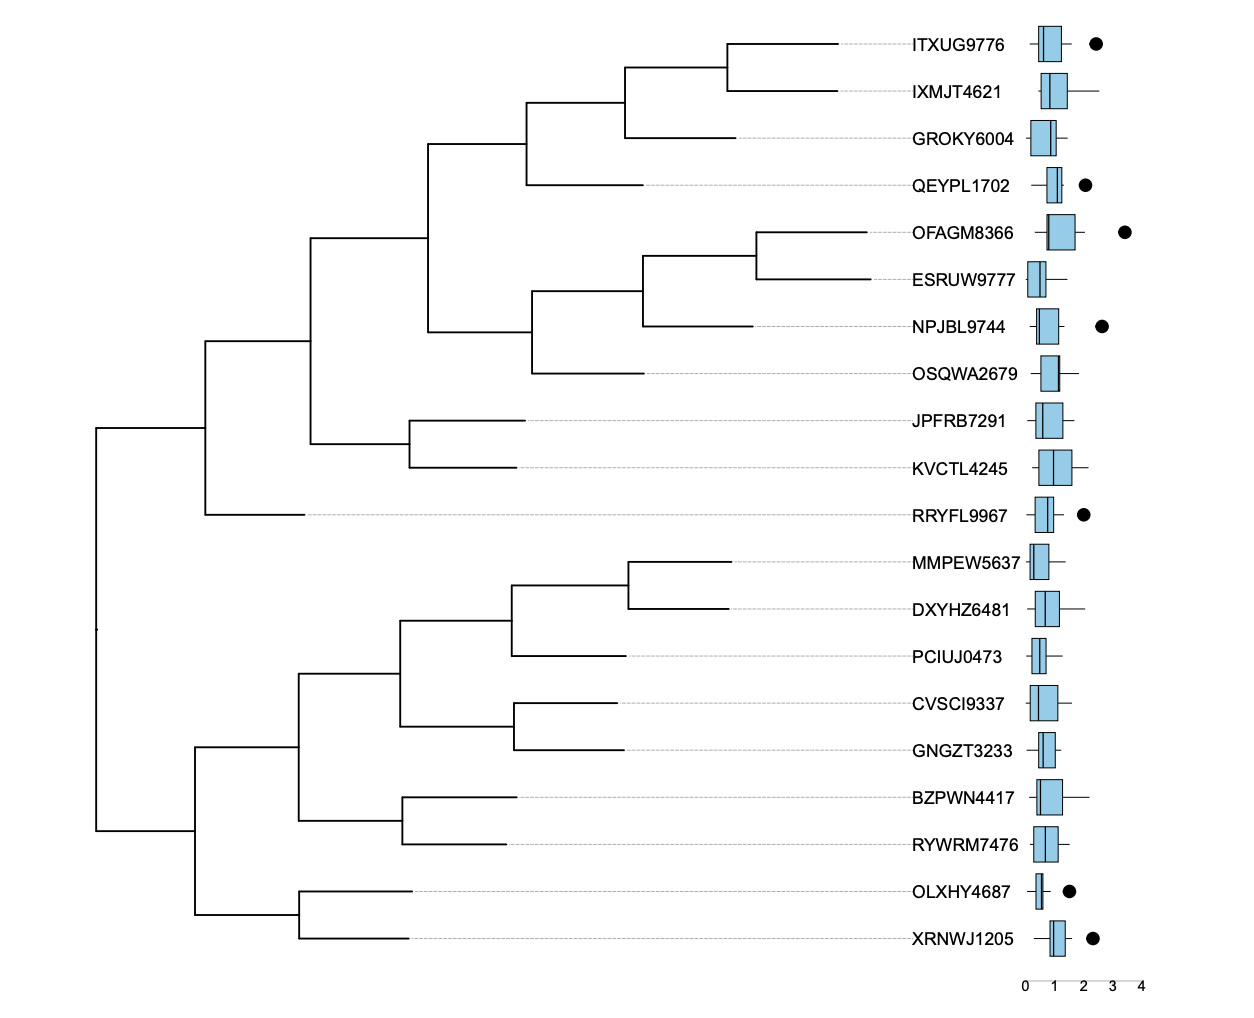
12.6 Box plot
Specifying the track type of leaf as ‘box’ enables the drawing of a box plot:
Prepare the leaf annotation file:
Choose ‘column’ as the continuous variable (value) for the box plot, it will be the y-axis value of each leaf.
Example data:
| id | value |
|---|---|
| OSQWA2679 | 1.7139226 |
| ESRUW9777 | 0.1692439 |
| OFAGM8366 | 0.7890045 |
| NPJBL9744 | 0.1380269 |
| IXMJT4621 | 2.5331384 |
| ITXUG9776 | 0.1402700 |
| GROKY6004 | 0.0877751 |
| QEYPL1702 | 0.3324896 |
| KVCTL4245 | 0.4958188 |
| JPFRB7291 | 1.6763859 |
| RRYFL9967 | 0.7254029 |
| XRNWJ1205 | 0.8223092 |
| OLXHY4687 | 0.5365051 |
| RYWRM7476 | 0.1955164 |
| BZPWN4417 | 1.6762909 |
| DXYHZ6481 | 0.0495314 |
| MMPEW5637 | 0.0134147 |
| PCIUJ0473 | 0.8426530 |
| GNGZT3233 | 1.0146761 |
| CVSCI9337 | 0.1381128 |
| OSQWA2679 | 1.1391237 |
| ESRUW9777 | 0.6916754 |
| OFAGM8366 | 3.4170925 |
| NPJBL9744 | 0.3702410 |
| IXMJT4621 | 0.6876392 |
| ITXUG9776 | 0.3520154 |
| GROKY6004 | 1.0738444 |
| QEYPL1702 | 1.2603112 |
| KVCTL4245 | 0.4417195 |
| JPFRB7291 | 0.0543929 |
| RRYFL9967 | 1.3202823 |
| XRNWJ1205 | 1.2026172 |
| OLXHY4687 | 0.2408666 |
| RYWRM7476 | 0.5810605 |
| BZPWN4417 | 0.3973637 |
| DXYHZ6481 | 1.1037415 |
| MMPEW5637 | 0.2369583 |
| PCIUJ0473 | 1.2722285 |
| GNGZT3233 | 1.0196708 |
| CVSCI9337 | 1.5938927 |
| OSQWA2679 | 0.4049199 |
| ESRUW9777 | 0.0034813 |
| OFAGM8366 | 0.4912153 |
| NPJBL9744 | 0.8548826 |
| IXMJT4621 | 2.2421701 |
| ITXUG9776 | 1.2994069 |
| GROKY6004 | 0.8203667 |
| QEYPL1702 | 1.0513009 |
| KVCTL4245 | 0.2231083 |
| JPFRB7291 | 0.3680792 |
| RRYFL9967 | 0.0249564 |
| XRNWJ1205 | 1.5978399 |
| OLXHY4687 | 0.3452257 |
| RYWRM7476 | 1.4500343 |
| BZPWN4417 | 0.2521606 |
| DXYHZ6481 | 1.8992152 |
| MMPEW5637 | 0.0139672 |
| PCIUJ0473 | 0.3236669 |
| GNGZT3233 | 0.0316505 |
| CVSCI9337 | 0.1521737 |
| OSQWA2679 | 1.8386026 |
| ESRUW9777 | 0.3293844 |
| OFAGM8366 | 0.8225729 |
| NPJBL9744 | 1.3337066 |
| IXMJT4621 | 1.4325406 |
| ITXUG9776 | 0.4031323 |
| GROKY6004 | 0.0139731 |
| QEYPL1702 | 1.1990303 |
| KVCTL4245 | 0.7451819 |
| JPFRB7291 | 1.4913384 |
| RRYFL9967 | 0.8062194 |
| XRNWJ1205 | 0.8239946 |
| OLXHY4687 | 1.5079721 |
| RYWRM7476 | 1.0203457 |
| BZPWN4417 | 0.6194179 |
| DXYHZ6481 | 2.0465736 |
| MMPEW5637 | 0.8001764 |
| PCIUJ0473 | 0.0208043 |
| GNGZT3233 | 0.5763465 |
| CVSCI9337 | 1.1345368 |
| OSQWA2679 | 0.8864298 |
| ESRUW9777 | 0.0402544 |
| OFAGM8366 | 2.0405460 |
| NPJBL9744 | 0.3900764 |
| IXMJT4621 | 0.5319518 |
| ITXUG9776 | 0.6353661 |
| GROKY6004 | 0.1376743 |
| QEYPL1702 | 0.1912515 |
| KVCTL4245 | 0.3128723 |
| JPFRB7291 | 0.3461296 |
| RRYFL9967 | 1.9989839 |
| XRNWJ1205 | 1.0400758 |
| OLXHY4687 | 0.5526598 |
| RYWRM7476 | 1.5144789 |
| BZPWN4417 | 0.3811676 |
| DXYHZ6481 | 1.1819449 |
| MMPEW5637 | 0.2991659 |
| PCIUJ0473 | 0.7365343 |
| GNGZT3233 | 1.0422128 |
| CVSCI9337 | 0.1700525 |
| OSQWA2679 | 0.1747209 |
| ESRUW9777 | 1.4388000 |
| OFAGM8366 | 0.8022827 |
| NPJBL9744 | 1.2308044 |
| IXMJT4621 | 0.5257156 |
| ITXUG9776 | 1.0239022 |
| GROKY6004 | 0.9037053 |
| QEYPL1702 | 1.3148140 |
| KVCTL4245 | 1.6196226 |
| JPFRB7291 | 0.7776291 |
| RRYFL9967 | 0.3716507 |
| XRNWJ1205 | 2.3177442 |
| OLXHY4687 | 0.3851916 |
| RYWRM7476 | 0.1991026 |
| BZPWN4417 | 0.1176758 |
| DXYHZ6481 | 0.4453197 |
| MMPEW5637 | 1.0093290 |
| PCIUJ0473 | 0.5976304 |
| GNGZT3233 | 0.4727152 |
| CVSCI9337 | 0.0003796 |
| OSQWA2679 | 1.1199306 |
| ESRUW9777 | 1.3958571 |
| OFAGM8366 | 0.7234590 |
| NPJBL9744 | 0.4626633 |
| IXMJT4621 | 0.9788236 |
| ITXUG9776 | 1.5865962 |
| GROKY6004 | 1.4471481 |
| QEYPL1702 | 1.0109909 |
| KVCTL4245 | 2.1631712 |
| JPFRB7291 | 0.3460799 |
| RRYFL9967 | 0.7885243 |
| XRNWJ1205 | 0.8841424 |
| OLXHY4687 | 0.6062781 |
| RYWRM7476 | 0.1444490 |
| BZPWN4417 | 2.1969155 |
| DXYHZ6481 | 0.9013570 |
| MMPEW5637 | 1.3755314 |
| PCIUJ0473 | 0.5871956 |
| GNGZT3233 | 1.2236890 |
| CVSCI9337 | 0.1966324 |
| OSQWA2679 | 1.1804610 |
| ESRUW9777 | 0.6567064 |
| OFAGM8366 | 0.3153820 |
| NPJBL9744 | 2.6317379 |
| IXMJT4621 | 0.5318544 |
| ITXUG9776 | 0.5783791 |
| GROKY6004 | 0.9792216 |
| QEYPL1702 | 0.6389339 |
| KVCTL4245 | 2.0289271 |
| JPFRB7291 | 0.7357921 |
| RRYFL9967 | 0.0724318 |
| XRNWJ1205 | 0.2830424 |
| OLXHY4687 | 0.0475461 |
| RYWRM7476 | 0.5188582 |
| BZPWN4417 | 1.1795441 |
| DXYHZ6481 | 0.2921048 |
| MMPEW5637 | 0.7915654 |
| PCIUJ0473 | 0.1252748 |
| GNGZT3233 | 0.4395111 |
| CVSCI9337 | 1.0279077 |
| OSQWA2679 | 0.2523669 |
| ESRUW9777 | 0.0228920 |
| OFAGM8366 | 0.7660293 |
| NPJBL9744 | 0.4806514 |
| IXMJT4621 | 1.4311540 |
| ITXUG9776 | 0.5941172 |
| GROKY6004 | 1.0895659 |
| QEYPL1702 | 2.0600244 |
| KVCTL4245 | 1.5102025 |
| JPFRB7291 | 0.4385944 |
| RRYFL9967 | 1.0164413 |
| XRNWJ1205 | 1.4155280 |
| OLXHY4687 | 0.8617560 |
| RYWRM7476 | 0.7761275 |
| BZPWN4417 | 1.3001602 |
| DXYHZ6481 | 0.4010517 |
| MMPEW5637 | 0.2601128 |
| PCIUJ0473 | 0.1800129 |
| GNGZT3233 | 0.6271655 |
| CVSCI9337 | 1.5569636 |
| OSQWA2679 | 1.1516524 |
| ESRUW9777 | 0.6992130 |
| OFAGM8366 | 1.9920143 |
| NPJBL9744 | 0.3106052 |
| IXMJT4621 | 0.4364596 |
| ITXUG9776 | 2.4271736 |
| GROKY6004 | 0.3010645 |
| QEYPL1702 | 1.1296851 |
| KVCTL4245 | 1.1725890 |
| JPFRB7291 | 1.4492794 |
| RRYFL9967 | 0.3099543 |
| XRNWJ1205 | 0.8783183 |
| OLXHY4687 | 0.5560619 |
| RYWRM7476 | 1.1508815 |
| BZPWN4417 | 0.4008188 |
| DXYHZ6481 | 0.3066845 |
| MMPEW5637 | 0.1228437 |
| PCIUJ0473 | 0.3823029 |
| GNGZT3233 | 0.0567727 |
| CVSCI9337 | 0.6852805 |
Other parameters:
Manual color: Allows users to manually specify colors for different categories or values.
Column order: Determines the order in which columns are displayed in the plot.
Offset: Specifies the offset for the plot.
Legend: Controls the display of the legend for the plot.
Border color: Sets the color of the borders around plot tiles.
Border width: Adjusts the width of the borders around plot tiles.
Track height: Defines the height of the entire track.
Alpha: Sets the transparency level for the plot.
Grid: Enables or disables the grid lines in the plot.
Axis: Specifies whether to display axes for the plot.
Font size: Adjusts the size of the font used for labels.
Label angle: Sets the angle of the labels in the plot.
Label align: Controls the alignment of labels in the plot (e.g., top, bottom, center).
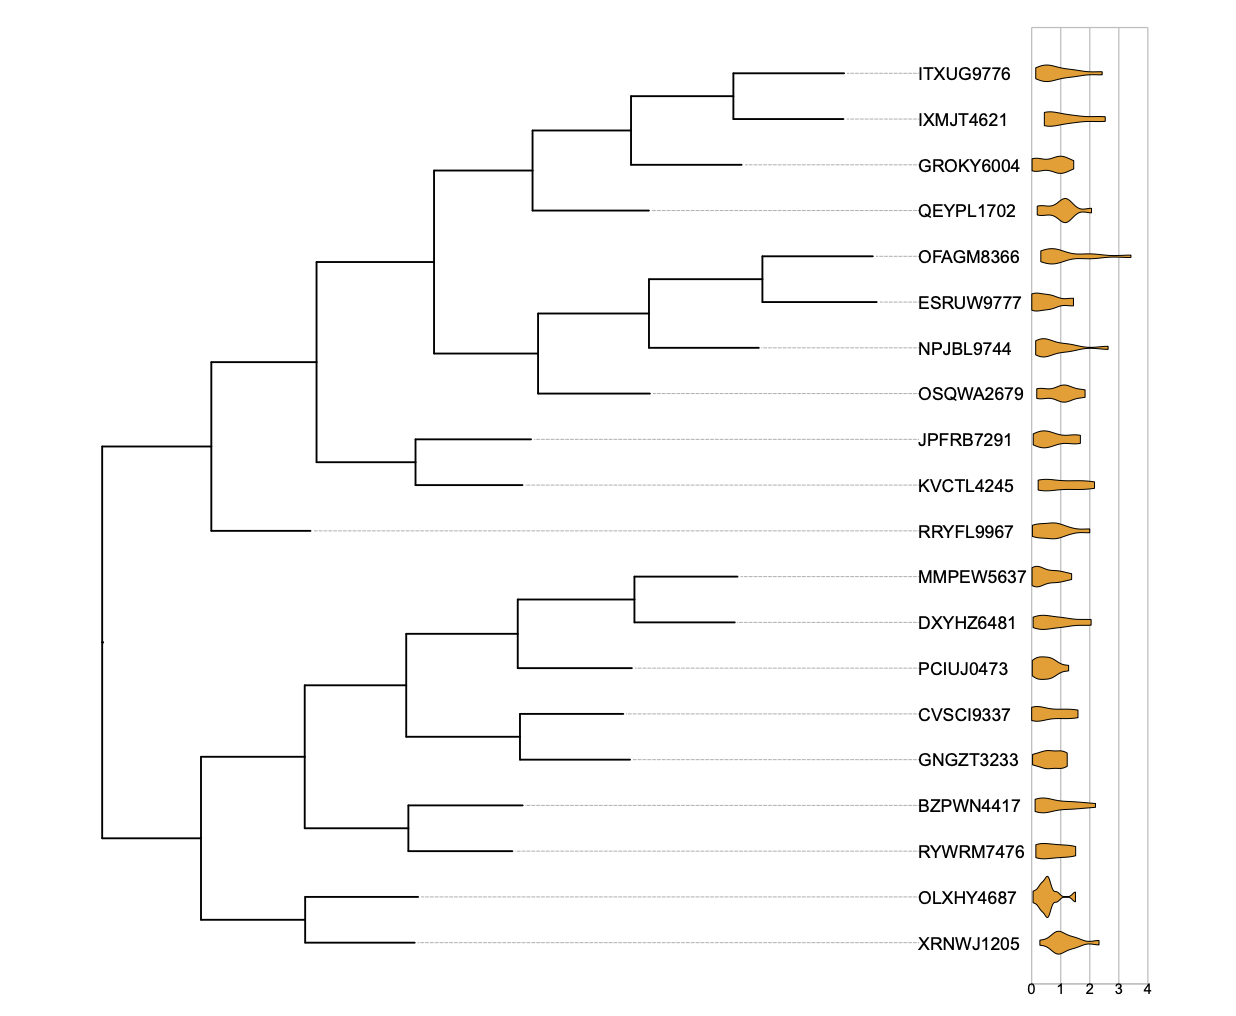
12.7 Violin plot
Specifying the track type of leaf as ‘violin’ enables the drawing of a violin plot:
Prepare the leaf annotation file:
Choose ‘column’ as the continuous variable (value) for the violin plot, it will be the y-axis value of each leaf.
Example data:
| id | value |
|---|---|
| OSQWA2679 | 1.7139226 |
| ESRUW9777 | 0.1692439 |
| OFAGM8366 | 0.7890045 |
| NPJBL9744 | 0.1380269 |
| IXMJT4621 | 2.5331384 |
| ITXUG9776 | 0.1402700 |
| GROKY6004 | 0.0877751 |
| QEYPL1702 | 0.3324896 |
| KVCTL4245 | 0.4958188 |
| JPFRB7291 | 1.6763859 |
| RRYFL9967 | 0.7254029 |
| XRNWJ1205 | 0.8223092 |
| OLXHY4687 | 0.5365051 |
| RYWRM7476 | 0.1955164 |
| BZPWN4417 | 1.6762909 |
| DXYHZ6481 | 0.0495314 |
| MMPEW5637 | 0.0134147 |
| PCIUJ0473 | 0.8426530 |
| GNGZT3233 | 1.0146761 |
| CVSCI9337 | 0.1381128 |
| OSQWA2679 | 1.1391237 |
| ESRUW9777 | 0.6916754 |
| OFAGM8366 | 3.4170925 |
| NPJBL9744 | 0.3702410 |
| IXMJT4621 | 0.6876392 |
| ITXUG9776 | 0.3520154 |
| GROKY6004 | 1.0738444 |
| QEYPL1702 | 1.2603112 |
| KVCTL4245 | 0.4417195 |
| JPFRB7291 | 0.0543929 |
| RRYFL9967 | 1.3202823 |
| XRNWJ1205 | 1.2026172 |
| OLXHY4687 | 0.2408666 |
| RYWRM7476 | 0.5810605 |
| BZPWN4417 | 0.3973637 |
| DXYHZ6481 | 1.1037415 |
| MMPEW5637 | 0.2369583 |
| PCIUJ0473 | 1.2722285 |
| GNGZT3233 | 1.0196708 |
| CVSCI9337 | 1.5938927 |
| OSQWA2679 | 0.4049199 |
| ESRUW9777 | 0.0034813 |
| OFAGM8366 | 0.4912153 |
| NPJBL9744 | 0.8548826 |
| IXMJT4621 | 2.2421701 |
| ITXUG9776 | 1.2994069 |
| GROKY6004 | 0.8203667 |
| QEYPL1702 | 1.0513009 |
| KVCTL4245 | 0.2231083 |
| JPFRB7291 | 0.3680792 |
| RRYFL9967 | 0.0249564 |
| XRNWJ1205 | 1.5978399 |
| OLXHY4687 | 0.3452257 |
| RYWRM7476 | 1.4500343 |
| BZPWN4417 | 0.2521606 |
| DXYHZ6481 | 1.8992152 |
| MMPEW5637 | 0.0139672 |
| PCIUJ0473 | 0.3236669 |
| GNGZT3233 | 0.0316505 |
| CVSCI9337 | 0.1521737 |
| OSQWA2679 | 1.8386026 |
| ESRUW9777 | 0.3293844 |
| OFAGM8366 | 0.8225729 |
| NPJBL9744 | 1.3337066 |
| IXMJT4621 | 1.4325406 |
| ITXUG9776 | 0.4031323 |
| GROKY6004 | 0.0139731 |
| QEYPL1702 | 1.1990303 |
| KVCTL4245 | 0.7451819 |
| JPFRB7291 | 1.4913384 |
| RRYFL9967 | 0.8062194 |
| XRNWJ1205 | 0.8239946 |
| OLXHY4687 | 1.5079721 |
| RYWRM7476 | 1.0203457 |
| BZPWN4417 | 0.6194179 |
| DXYHZ6481 | 2.0465736 |
| MMPEW5637 | 0.8001764 |
| PCIUJ0473 | 0.0208043 |
| GNGZT3233 | 0.5763465 |
| CVSCI9337 | 1.1345368 |
| OSQWA2679 | 0.8864298 |
| ESRUW9777 | 0.0402544 |
| OFAGM8366 | 2.0405460 |
| NPJBL9744 | 0.3900764 |
| IXMJT4621 | 0.5319518 |
| ITXUG9776 | 0.6353661 |
| GROKY6004 | 0.1376743 |
| QEYPL1702 | 0.1912515 |
| KVCTL4245 | 0.3128723 |
| JPFRB7291 | 0.3461296 |
| RRYFL9967 | 1.9989839 |
| XRNWJ1205 | 1.0400758 |
| OLXHY4687 | 0.5526598 |
| RYWRM7476 | 1.5144789 |
| BZPWN4417 | 0.3811676 |
| DXYHZ6481 | 1.1819449 |
| MMPEW5637 | 0.2991659 |
| PCIUJ0473 | 0.7365343 |
| GNGZT3233 | 1.0422128 |
| CVSCI9337 | 0.1700525 |
| OSQWA2679 | 0.1747209 |
| ESRUW9777 | 1.4388000 |
| OFAGM8366 | 0.8022827 |
| NPJBL9744 | 1.2308044 |
| IXMJT4621 | 0.5257156 |
| ITXUG9776 | 1.0239022 |
| GROKY6004 | 0.9037053 |
| QEYPL1702 | 1.3148140 |
| KVCTL4245 | 1.6196226 |
| JPFRB7291 | 0.7776291 |
| RRYFL9967 | 0.3716507 |
| XRNWJ1205 | 2.3177442 |
| OLXHY4687 | 0.3851916 |
| RYWRM7476 | 0.1991026 |
| BZPWN4417 | 0.1176758 |
| DXYHZ6481 | 0.4453197 |
| MMPEW5637 | 1.0093290 |
| PCIUJ0473 | 0.5976304 |
| GNGZT3233 | 0.4727152 |
| CVSCI9337 | 0.0003796 |
| OSQWA2679 | 1.1199306 |
| ESRUW9777 | 1.3958571 |
| OFAGM8366 | 0.7234590 |
| NPJBL9744 | 0.4626633 |
| IXMJT4621 | 0.9788236 |
| ITXUG9776 | 1.5865962 |
| GROKY6004 | 1.4471481 |
| QEYPL1702 | 1.0109909 |
| KVCTL4245 | 2.1631712 |
| JPFRB7291 | 0.3460799 |
| RRYFL9967 | 0.7885243 |
| XRNWJ1205 | 0.8841424 |
| OLXHY4687 | 0.6062781 |
| RYWRM7476 | 0.1444490 |
| BZPWN4417 | 2.1969155 |
| DXYHZ6481 | 0.9013570 |
| MMPEW5637 | 1.3755314 |
| PCIUJ0473 | 0.5871956 |
| GNGZT3233 | 1.2236890 |
| CVSCI9337 | 0.1966324 |
| OSQWA2679 | 1.1804610 |
| ESRUW9777 | 0.6567064 |
| OFAGM8366 | 0.3153820 |
| NPJBL9744 | 2.6317379 |
| IXMJT4621 | 0.5318544 |
| ITXUG9776 | 0.5783791 |
| GROKY6004 | 0.9792216 |
| QEYPL1702 | 0.6389339 |
| KVCTL4245 | 2.0289271 |
| JPFRB7291 | 0.7357921 |
| RRYFL9967 | 0.0724318 |
| XRNWJ1205 | 0.2830424 |
| OLXHY4687 | 0.0475461 |
| RYWRM7476 | 0.5188582 |
| BZPWN4417 | 1.1795441 |
| DXYHZ6481 | 0.2921048 |
| MMPEW5637 | 0.7915654 |
| PCIUJ0473 | 0.1252748 |
| GNGZT3233 | 0.4395111 |
| CVSCI9337 | 1.0279077 |
| OSQWA2679 | 0.2523669 |
| ESRUW9777 | 0.0228920 |
| OFAGM8366 | 0.7660293 |
| NPJBL9744 | 0.4806514 |
| IXMJT4621 | 1.4311540 |
| ITXUG9776 | 0.5941172 |
| GROKY6004 | 1.0895659 |
| QEYPL1702 | 2.0600244 |
| KVCTL4245 | 1.5102025 |
| JPFRB7291 | 0.4385944 |
| RRYFL9967 | 1.0164413 |
| XRNWJ1205 | 1.4155280 |
| OLXHY4687 | 0.8617560 |
| RYWRM7476 | 0.7761275 |
| BZPWN4417 | 1.3001602 |
| DXYHZ6481 | 0.4010517 |
| MMPEW5637 | 0.2601128 |
| PCIUJ0473 | 0.1800129 |
| GNGZT3233 | 0.6271655 |
| CVSCI9337 | 1.5569636 |
| OSQWA2679 | 1.1516524 |
| ESRUW9777 | 0.6992130 |
| OFAGM8366 | 1.9920143 |
| NPJBL9744 | 0.3106052 |
| IXMJT4621 | 0.4364596 |
| ITXUG9776 | 2.4271736 |
| GROKY6004 | 0.3010645 |
| QEYPL1702 | 1.1296851 |
| KVCTL4245 | 1.1725890 |
| JPFRB7291 | 1.4492794 |
| RRYFL9967 | 0.3099543 |
| XRNWJ1205 | 0.8783183 |
| OLXHY4687 | 0.5560619 |
| RYWRM7476 | 1.1508815 |
| BZPWN4417 | 0.4008188 |
| DXYHZ6481 | 0.3066845 |
| MMPEW5637 | 0.1228437 |
| PCIUJ0473 | 0.3823029 |
| GNGZT3233 | 0.0567727 |
| CVSCI9337 | 0.6852805 |
Other parameters:
Manual color: Allows users to manually specify colors for different categories or values.
Column order: Determines the order in which columns are displayed in the plot.
Offset: Specifies the offset for the plot.
Legend: Controls the display of the legend for the plot.
Border color: Sets the color of the borders around plot tiles.
Border width: Adjusts the width of the borders around plot tiles.
Track height: Defines the height of the entire track.
Alpha: Sets the transparency level for the plot.
Grid: Enables or disables the grid lines in the plot.
Axis: Specifies whether to display axes for the plot.
Font size: Adjusts the size of the font used for labels.
Label angle: Sets the angle of the labels in the plot.
Label align: Controls the alignment of labels in the plot (e.g., top, bottom, center).