13 Node annotation
The “Node Annotation” tab handles annotation tracks related to internal nodes and branches, including strips, clade branch colors, clade backgrounds, and node labels.
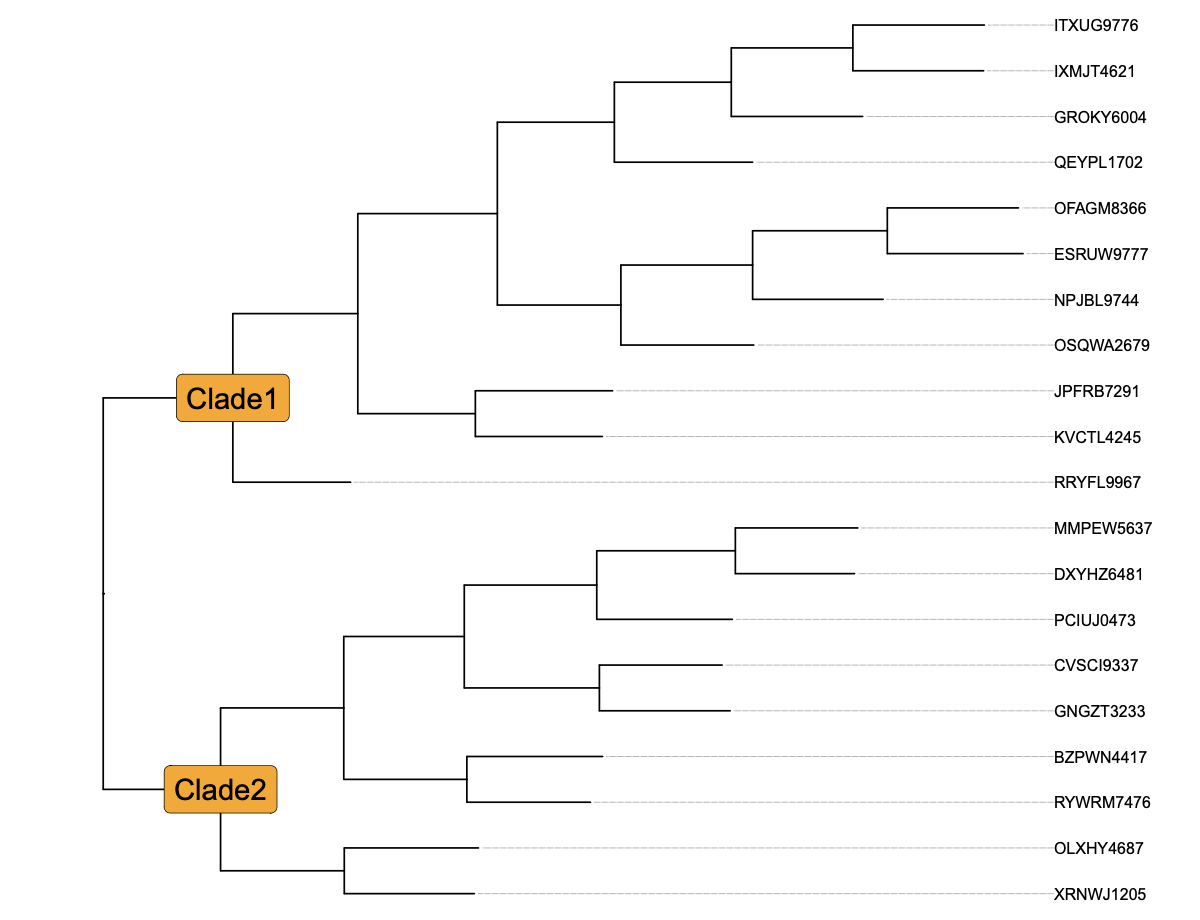
13.1 Node label
Specifying the track type of node as ‘node label’ enables showing node labels:
Prepare the node annotation file:
Choose ‘label’ as the column name containing the labels we want to map.
Choose ‘color’ as the column name containing the values we want to map. If the values are continuous, it will draw a gradient of colors.
Choose ‘size’ as the continuous variable for the label size.
Choose ‘background’ as the column name containing the values we want to map. If the values are continuous, it will draw a gradient of colors.
Example data:
| id | clade |
|---|---|
| 22 | Clade1 |
| 32 | Clade2 |
Other parameters:
Manual color: Allows users to manually specify colors for different categories or values.
Manual size: Allows users to manually specify size of points for different values.
Offset x: Specifies the offset for the labels at x-axis.
Offset y: Specifies the offset for the labels at y-axis.
Alpha: Sets the transparency level for the plot.
Label display: Sets the direction of node labels (rotating or horizontal?).
Border: Specifies whether to plot the border.
Legend: Controls the display of the legend for the plot.
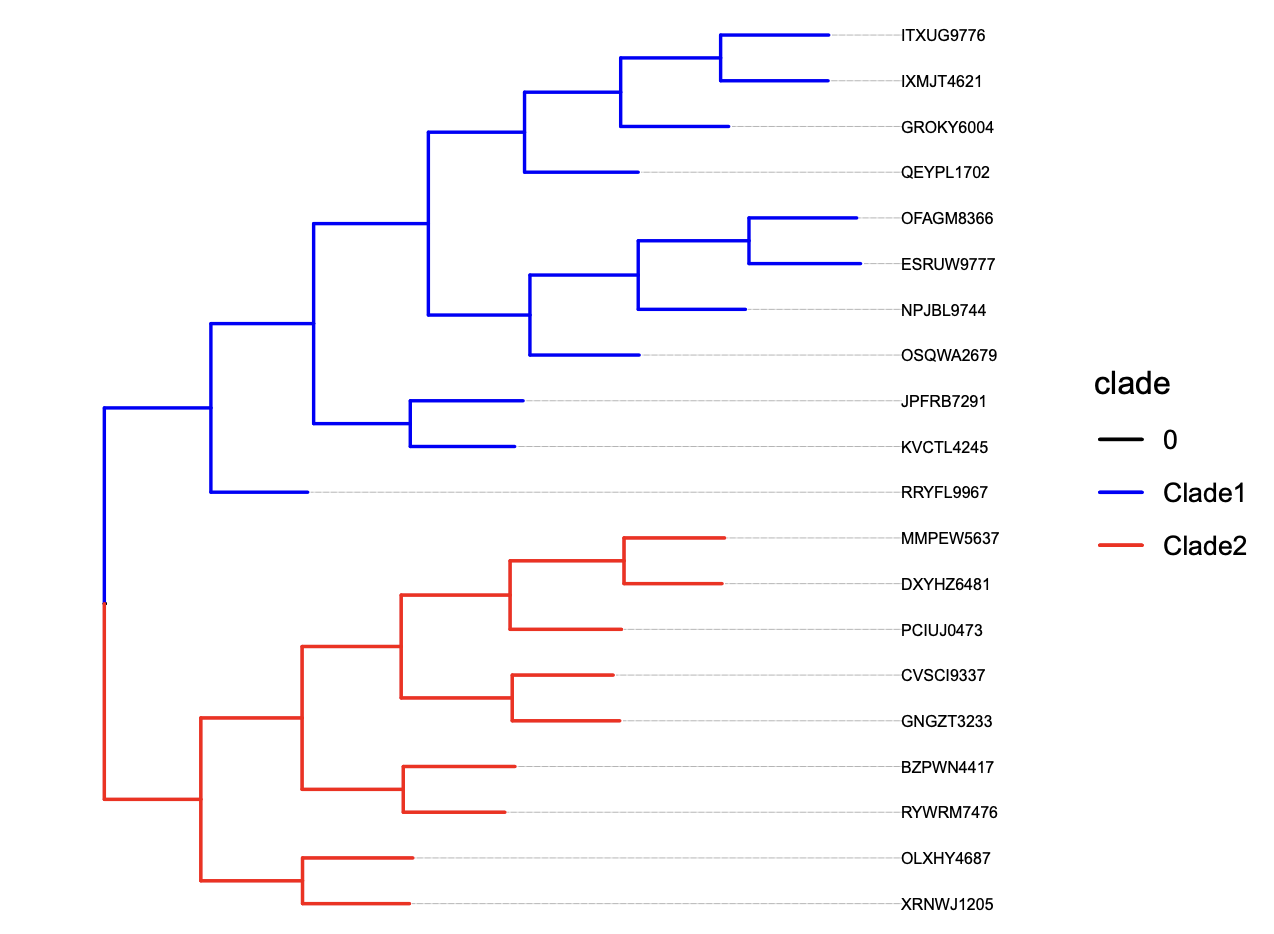
13.2 Color branch
Specifying the track type of node as ‘color branch’ enables the coloring branch of a tree plot:
Prepare the node annotation file:
Choose ‘color’ as the variable (clade) for coloring branch.
Example data:
| id | clade |
|---|---|
| 22 | Clade1 |
| 32 | Clade2 |
Other parameters:
Manual color: Allows users to manually specify colors for different categories or values.
Legend: Controls the display of the legend for the plot.
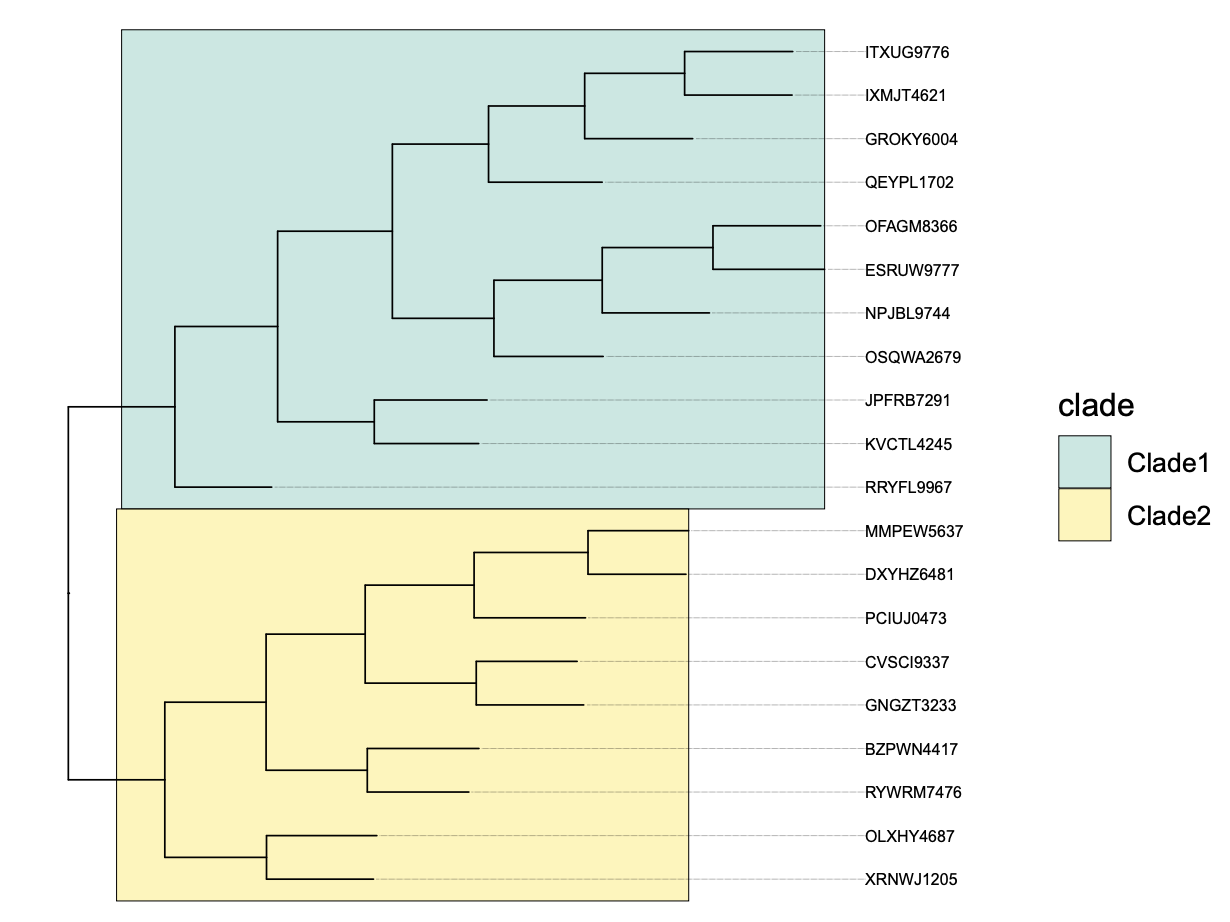
13.3 Highlight
Specifying the track type of node as ‘highlight’ enables the highlighting of a tree plot:
Prepare the node annotation file:
Choose ‘color’ as the variable (clade) for highlighting branch.
Example data:
| id | clade |
|---|---|
| 22 | Clade1 |
| 32 | Clade2 |
Other parameters:
Manual color: Allows users to manually specify colors for different categories or values.
Legend: Controls the display of the legend for the plot.
Border color: Sets the color of the borders around plot tiles.
Border width: Adjusts the width of the borders around plot tiles.
Alpha: Sets the transparency level for the plot.
To bottom: Control the highlighting to the bottom of the plot.
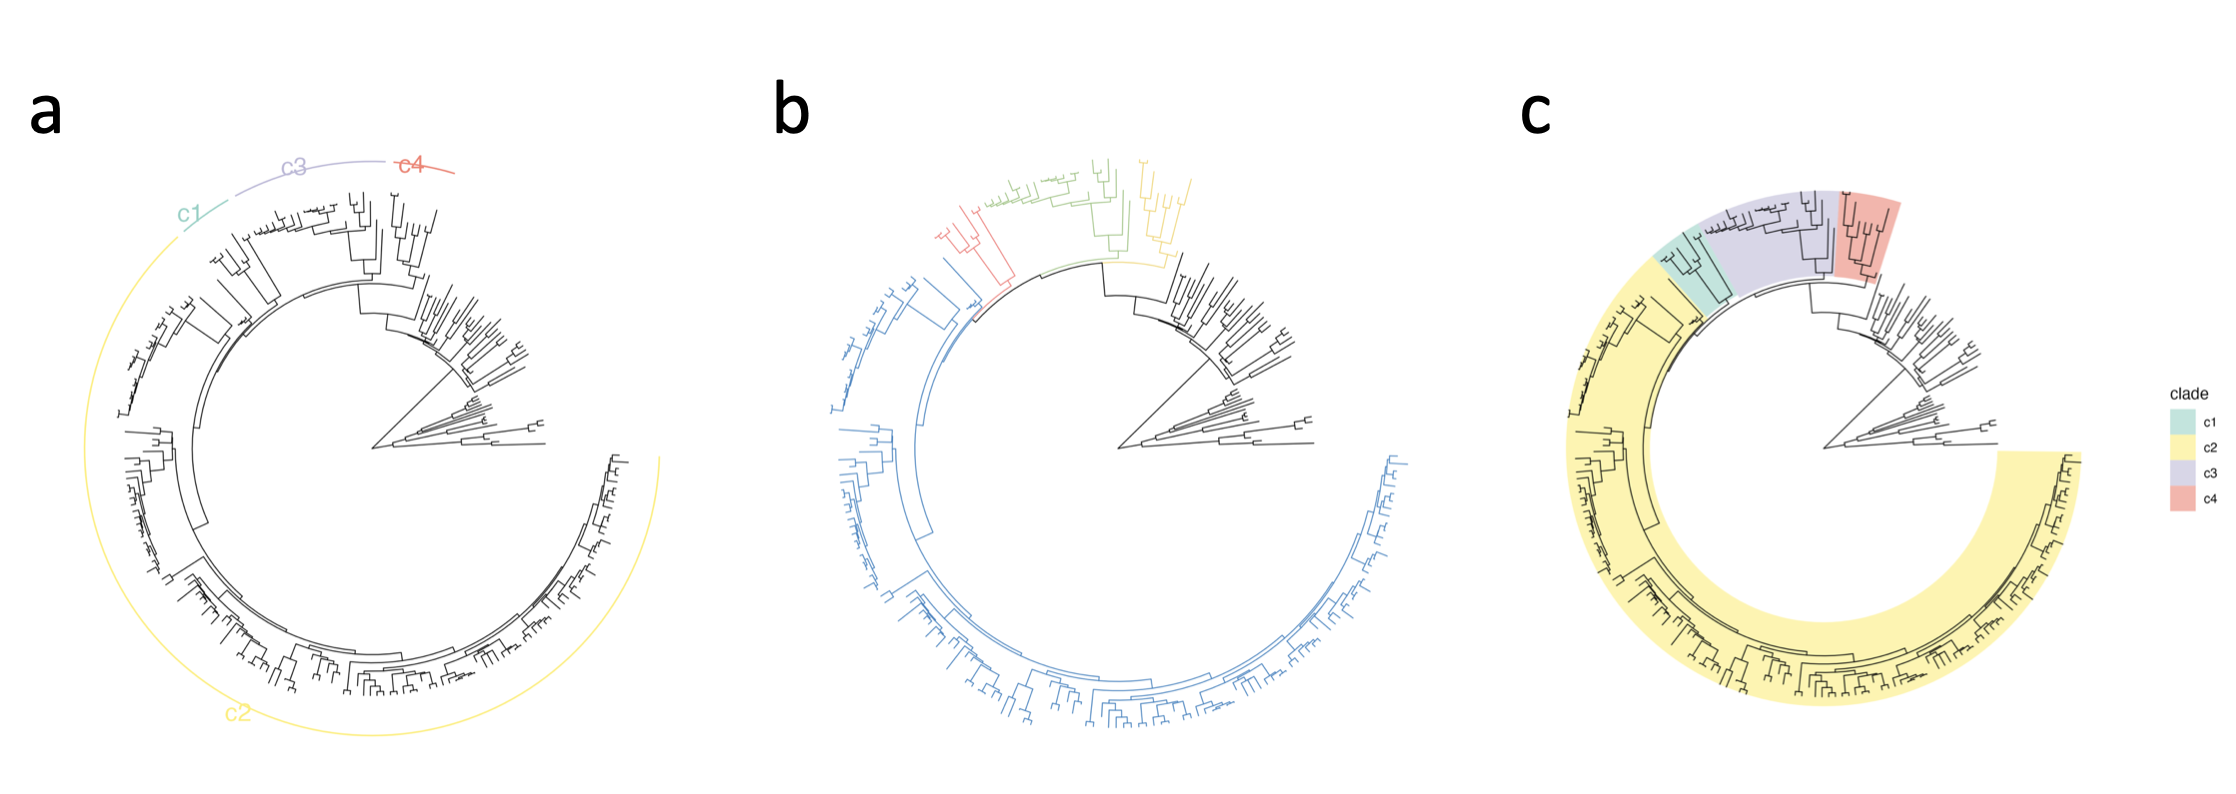
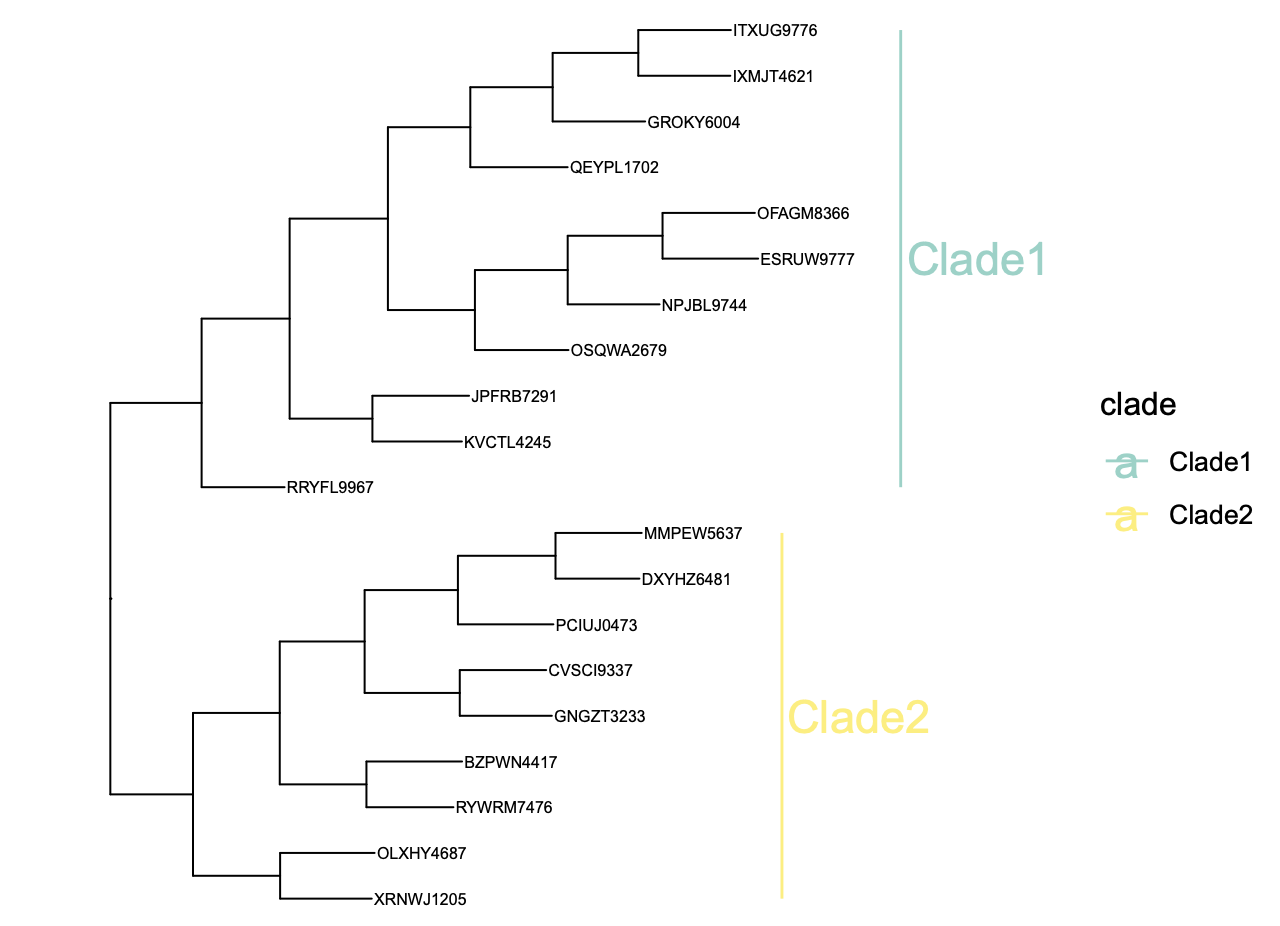
13.4 Strip
Specifying the track type of node as ‘strip’ enables the drawing of strips of a tree plot:
Prepare the node annotation file:
Choose ‘color’ as the variable (clade) for drawing strips.
Example data:
| id | clade |
|---|---|
| 22 | Clade1 |
| 32 | Clade2 |
Other parameters:
Manual color: Allows users to manually specify colors for different categories or values.
Offset: Specifies the offset for the plot.
Legend: Controls the display of the legend for the plot.
Alpha: Sets the transparency level for the plot.
Font size: Adjusts the size of the font used for labels.
Label offset: Sets the offset of the labels in the plot.