8 iPhylo Visual

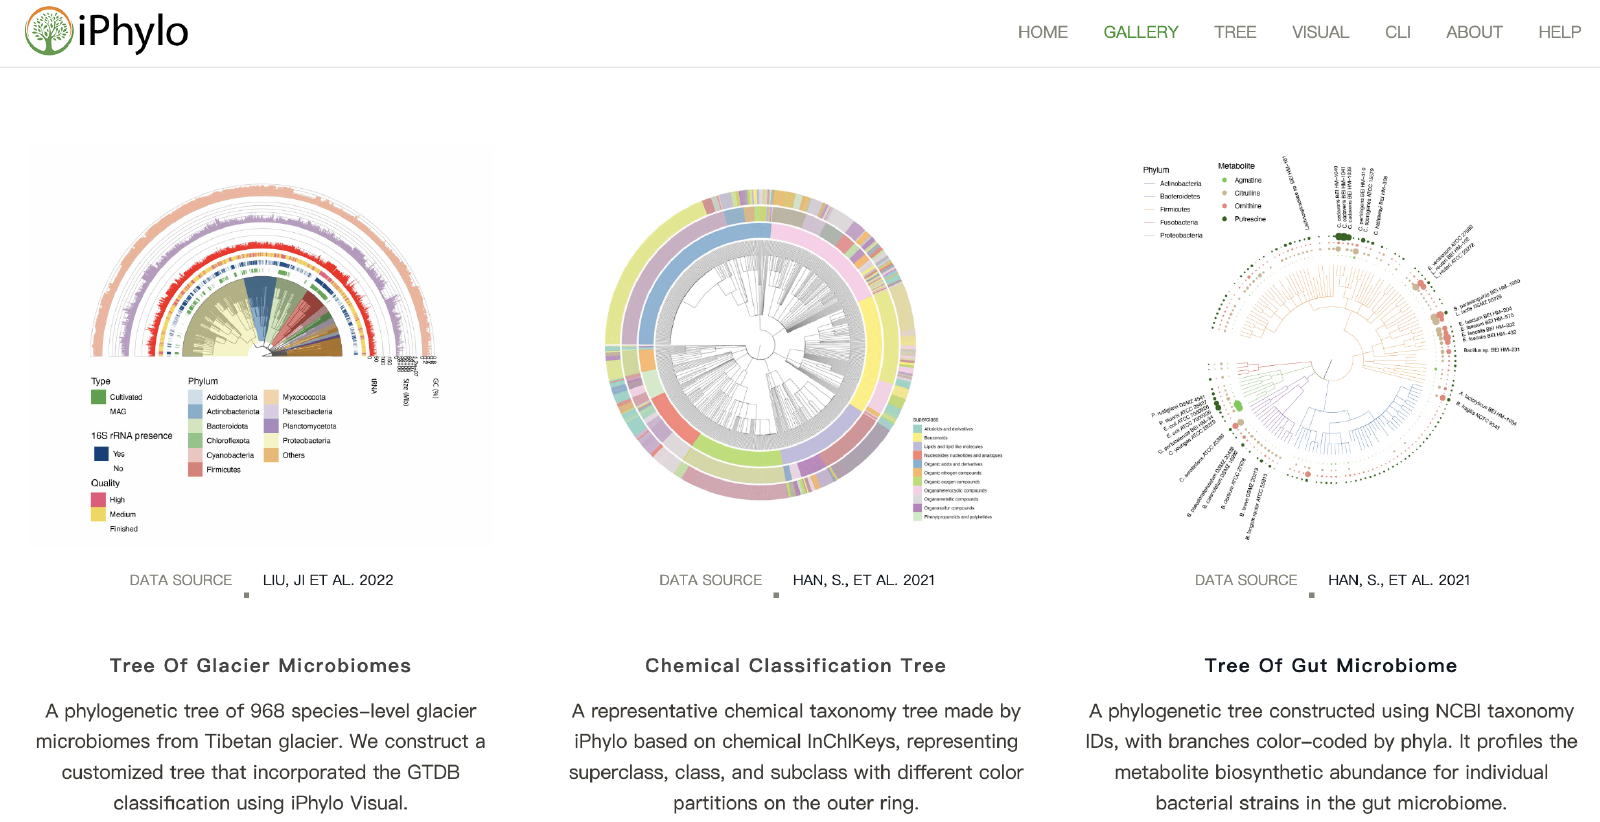
The iPhylo Visual was developed based on the R framework for visualizing and extensively annotating taxonomic trees (https://www.iphylo.net/visual/). The iPhylo Visual also offers the convenience of saving and uploading work sessions locally, as well as access to source codes for plotting and annotating. The iPhylo Visual leverages the full graphical capabilities of ggtree1 and ggtreeExtra2 for visualizing, manipulating, and annotating tree-structured data.

The iPhylo Visual is an interactive online tool designed to facilitate the display, annotation, and inspection of tree-based structures, including but not limited to phylogenetic and chemical taxonomic trees generated from iPhylo modules.
The iPhylo Visual simplifies the process of annotating taxonomic trees by adopting a data frame-compatible format, enabling users to encapsulate all required information within one data frame for leaf annotation and one data frame for node annotation, respectively. Within the data frame, rows correspond to tree nodes, and columns represent specific features. Users can efficiently navigate and manage these uploaded data frames through the provided online table viewer, with sorting and retrieval capabilities. This design avoids uploading multiple annotation files and is directly compatible with R.
Guangchuang Yu. Using ggtree to visualize data on tree-like structures. Current Protocols in Bioinformatics, 2020, 69:e96. doi:10.1002/cpbi.96↩︎
S Xu, Z Dai, P Guo, X Fu, S Liu, L Zhou, W Tang, T Feng, M Chen, L Zhan, T Wu, E Hu, Y Jiang, X Bo, G Yu. ggtreeExtra: Compact visualization of richly annotated phylogenetic data. Molecular Biology and Evolution 2021, 38(9):4039-4042. doi:10.1093/molbev/msab166↩︎