Envfit test for RDA result
envfitt(phy.rda, env, ...)Value
g_test object
See also
Examples
data(otutab, package = "pcutils")
env <- metadata[, 6:10]
# RDA
myRDA(otutab, env) -> phy.rda
#> ==================================Check models==================================
#> DCA analysis, select the sorting analysis model according to the first value of the Axis lengths row.
#> - If it is more than 4.0 - CCA (based on unimodal model, canonical correspondence analysis);
#> - If it is between 3.0-4.0 - both RDA/CCA;
#> - If it is less than 3.0 - RDA (based on linear model, redundancy analysis)
#>
#> Call:
#> vegan::decorana(veg = dat.h)
#>
#> Detrended correspondence analysis with 26 segments.
#> Rescaling of axes with 4 iterations.
#> Total inertia (scaled Chi-square): 0.3192
#>
#>                         DCA1    DCA2    DCA3     DCA4
#> Eigenvalues          0.03142 0.02276 0.01927 0.017818
#> Additive Eigenvalues 0.03142 0.02276 0.01927 0.017881
#> Decorana values      0.03169 0.02142 0.01511 0.009314
#> Axis lengths         0.73929 0.72605 0.52357 0.666913
#>
#> =================================Initial Model==================================
#> Initial cca, vif>20 indicates serious collinearity:
#>     env4     env5     env6      lat     long
#> 2.574997 2.674671 1.252002 1.381839 1.211392
#> Initial Model R-square: 0.04828743
#> ===================================Statistics===================================
#> 0.3282029 constrained indicates the degree to which environmental factors explain differences in community structure
#> 0.6717971 unconstrained means that the environmental factors cannot explain the part of the community structure
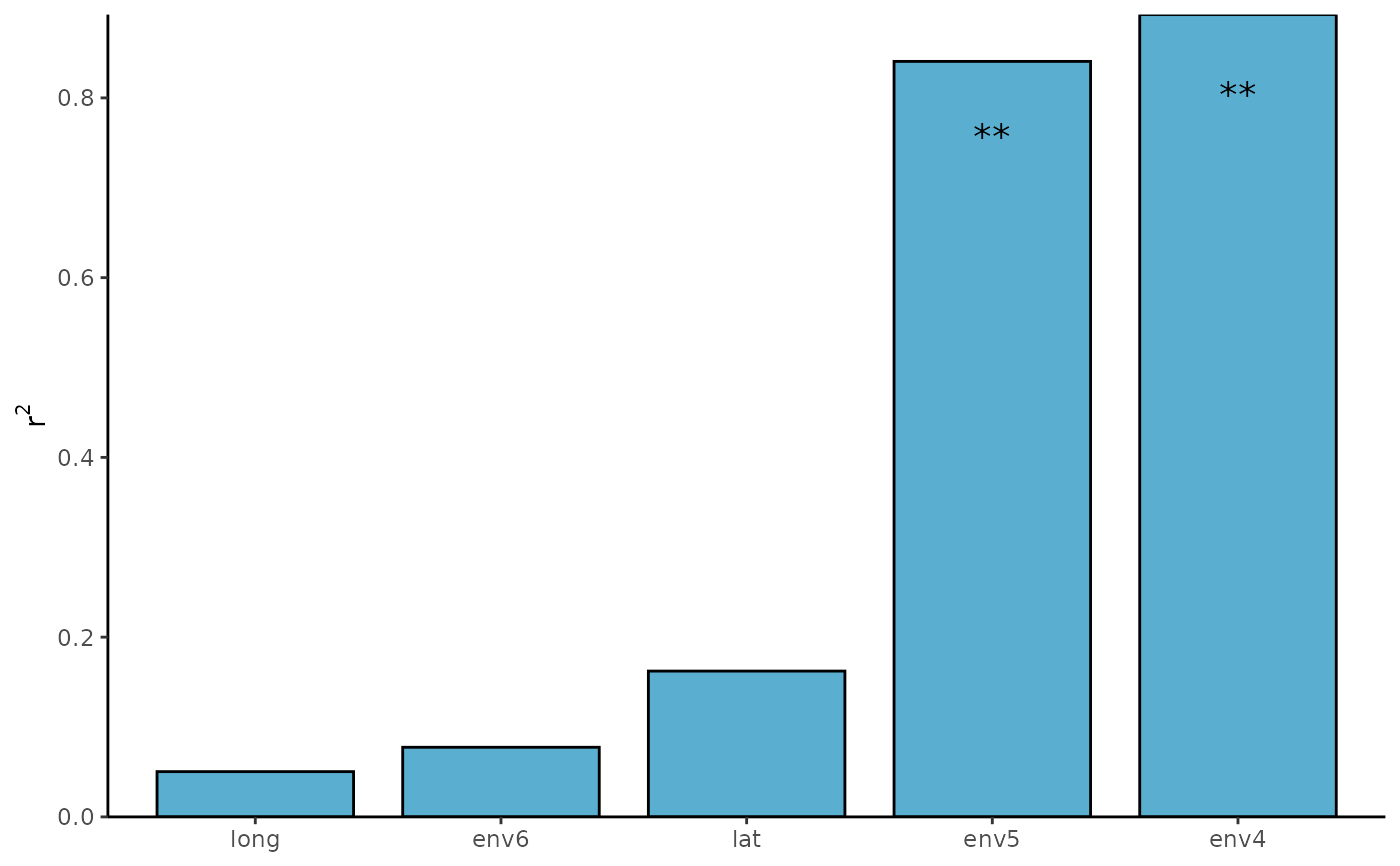
envfitt(phy.rda, env) -> envfit_res
plot(envfit_res)
#> Warning: Arguments in `...` must be used.
#> ✖ Problematic argument:
#> • size = 2
#> ℹ Did you misspell an argument name?
