Plot a stack plot
Plot a area plot
stackplot(
  otutab,
  metadata = NULL,
  group = "Group",
  get_data = FALSE,
  bar_params = list(width = 0.7, position = "stack"),
  topN = 8,
  others = TRUE,
  relative = TRUE,
  legend_title = "",
  stack_order = TRUE,
  group_order = FALSE,
  facet_order = FALSE,
  style = c("group", "sample")[1],
  flow = FALSE,
  flow_params = list(lode.guidance = "frontback", color = "darkgray"),
  number = FALSE,
  repel = FALSE,
  format_params = list(digits = 2),
  text_params = list(position = position_stack())
)

areaplot(
  otutab,
  metadata = NULL,
  group = "Group",
  get_data = FALSE,
  bar_params = list(position = "stack"),
  topN = 8,
  others = TRUE,
  relative = TRUE,
  legend_title = "",
  stack_order = TRUE,
  group_order = FALSE,
  facet_order = FALSE,
  style = c("group", "sample")[1],
  number = FALSE,
  format_params = list(digits = 2),
  text_params = list(position = position_stack())
)
Arguments
- otutab
otutab
- metadata
metadata
- group
one group name of columns of metadata
- get_data
just get the formatted data?
- bar_params
parameters parse to
geom_bar- topN
plot how many top species
- others
should plot others?
- relative
transfer to relative or absolute
- legend_title
fill legend_title
- stack_order
the order of stack fill
- group_order
the order of x group, can be T/F, or a vector of x, or a name, or "cluster"
- facet_order
the order of the facet
- style
"group" or "sample"
- flow
should plot a flow plot?
- flow_params
parameters parse to
geom_flow- number
show the number?
- repel
use the ggrepel::geom_text_repel instead of geom_text
- format_params
parameters parse to
format- text_params
parameters parse to
geom_text
Value
a ggplot
a ggplot
Examples
data(otutab)
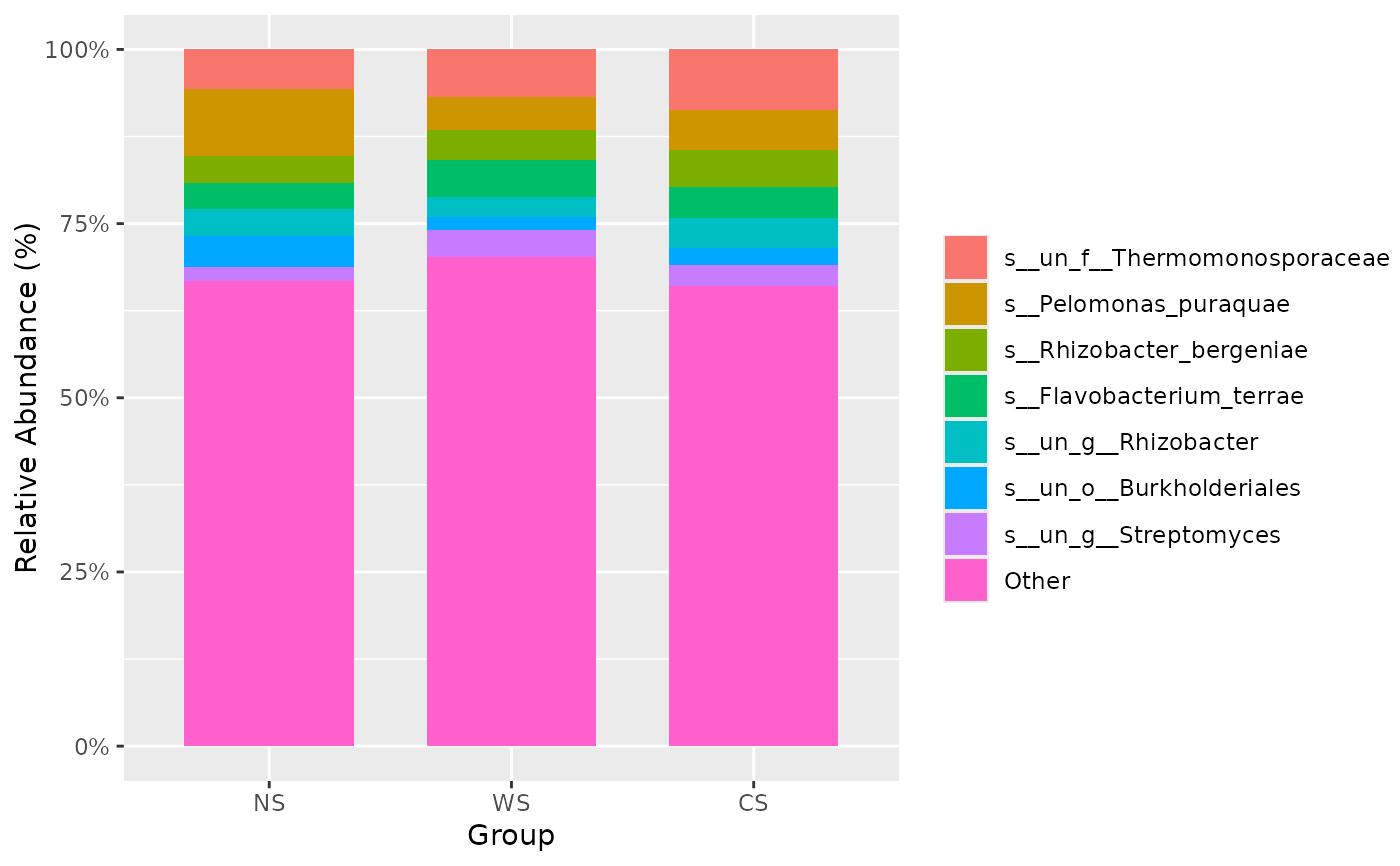
stackplot(otutab, metadata, group = "Group")

# \donttest{
if (interactive()) {
  stackplot(otutab, metadata,
    group = "Group", style = "sample",
    group_order = TRUE, flow = TRUE, relative = FALSE
  )
}
# }
data(otutab)
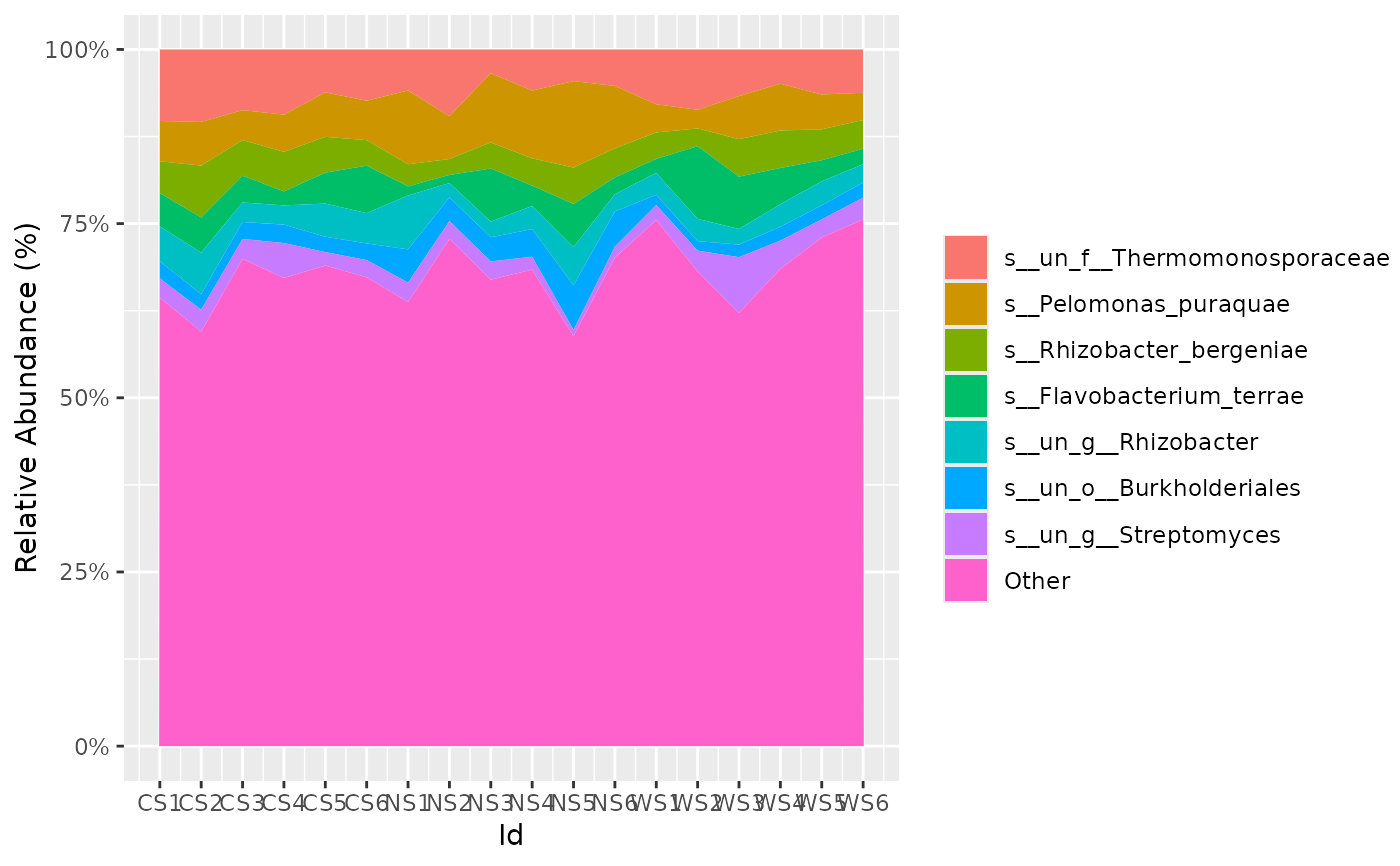
areaplot(otutab, metadata, group = "Id")

# \donttest{
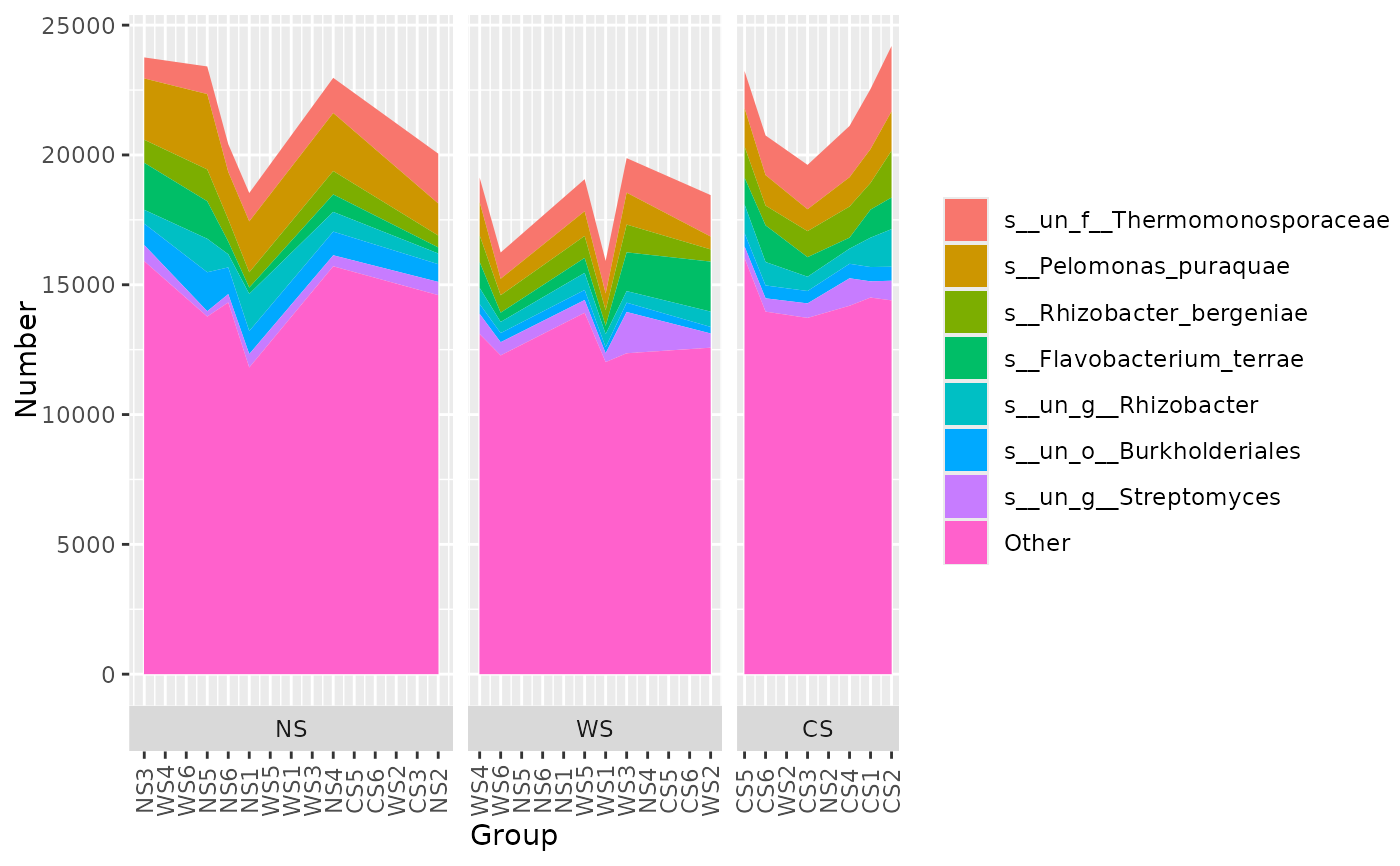
areaplot(otutab, metadata,
  group = "Group", style = "sample",
  group_order = TRUE, relative = FALSE
)

# }
# }