Plot a boxplot
group_box(
  tab,
  group = NULL,
  metadata = NULL,
  mode = 1,
  group_order = NULL,
  facet_order = NULL,
  facet_ncol = NULL,
  paired = FALSE,
  paired_line_param = list(),
  alpha = FALSE,
  method = "wilcox",
  alpha_param = list(),
  point_param = NULL,
  p_value1 = FALSE,
  p_value2 = FALSE,
  only_sig = TRUE,
  stat_compare_means_param = NULL,
  trend_line = FALSE,
  trend_line_param = list()
)
Arguments
- tab
your dataframe
- group
which colname choose for group or a vector
- metadata
the dataframe contains the group
- mode
1~9, plot style, try yourself
- group_order
the order of x group
- facet_order
the order of the facet
- facet_ncol
number of columns in facet, if NULL, will use the default value of ggplot2
- paired
if paired is TRUE, points in different groups will be connected by lines. So the row names order is important.
- paired_line_param
parameters parse to
geom_line.- alpha
whether plot a group alphabeta by test of method
- method
test method:wilcox, tukeyHSD, LSD, (default: wilcox), see
multitest- alpha_param
parameters parse to
geom_text- point_param
parameters parse to
geom_point,- p_value1
multi-test of all group
- p_value2
two-test of each pair
- only_sig
only_sig for p_value2
- stat_compare_means_param
parameters parse to
stat_compare_means- trend_line
add a trend line
- trend_line_param
parameters parse to
geom_smooth
Value
a ggplot
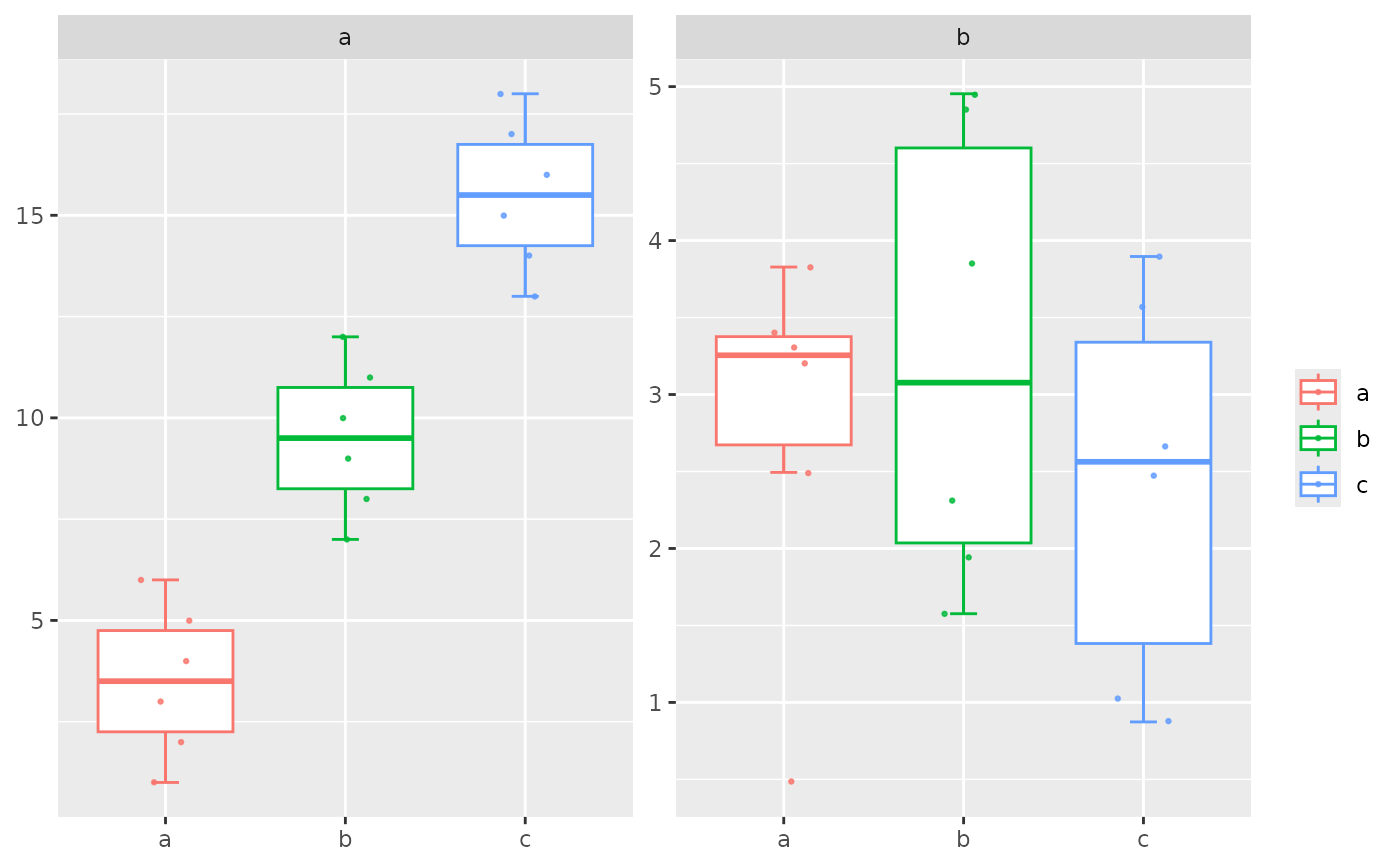
Examples
a <- data.frame(a = 1:18, b = runif(18, 0, 5))
group_box(a, group = rep(c("a", "b", "c"), each = 6))