Plot a doughnut chart
gghuan(
  tab,
  reorder = TRUE,
  mode = "1",
  topN = 5,
  name = TRUE,
  percentage = TRUE,
  bar_params = NULL,
  text_params = NULL,
  text_params2 = NULL
)
Arguments
- tab
two columns: first is type, second is number
- reorder
reorder by number?
- mode
plot style, 1~3
- topN
plot how many top items
- name
label the name
- percentage
label the percentage
- bar_params
parameters parse to
geom_rect, for mode=1,3 orgeom_colfor mode=2.- text_params
parameters parse to
geom_text- text_params2
parameters parse to
geom_text, for name=TRUE & mode=1,3
Value
a ggplot
Examples
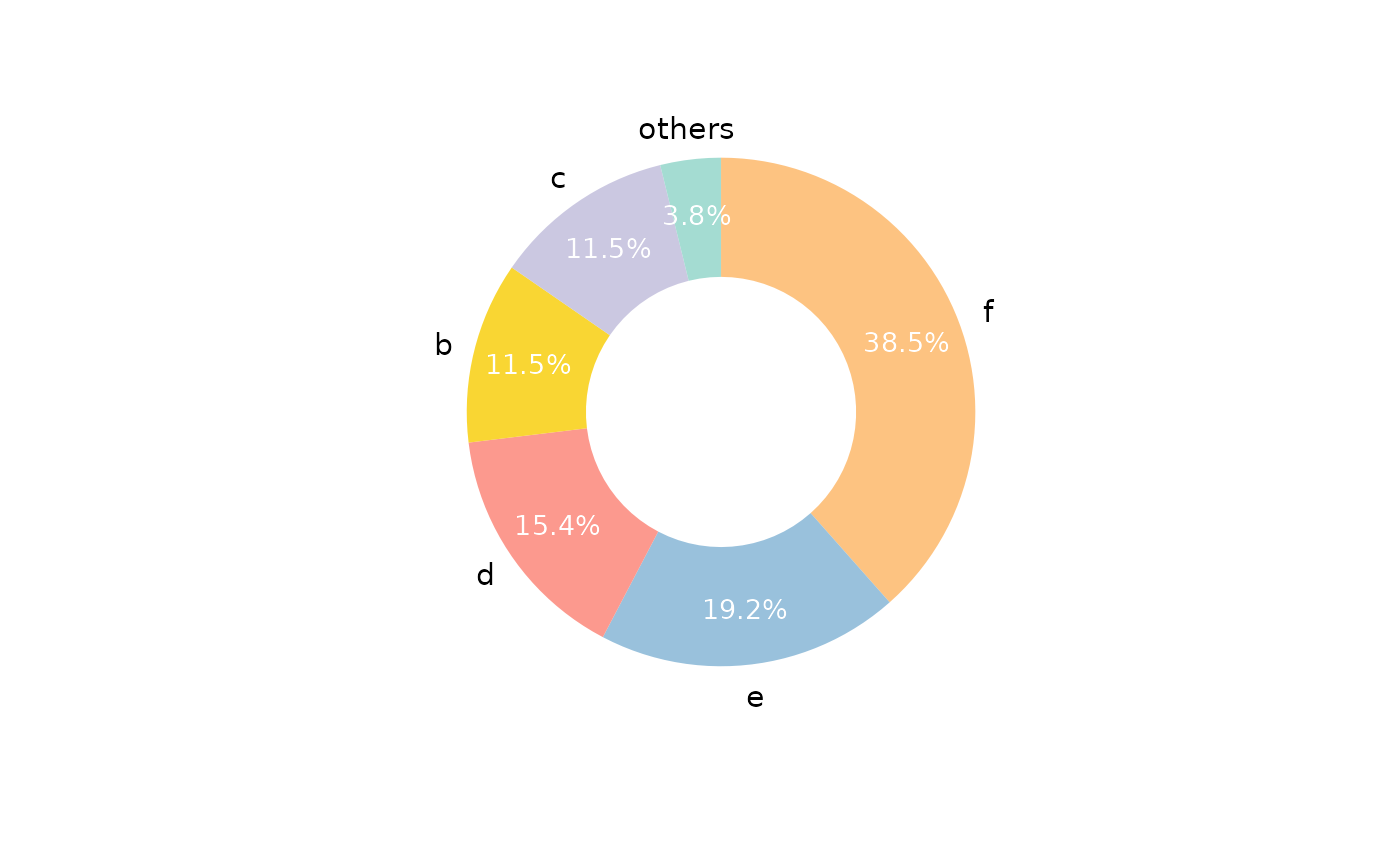
a <- data.frame(type = letters[1:6], num = c(1, 3, 3, 4, 5, 10))
gghuan(a) + scale_fill_pc()

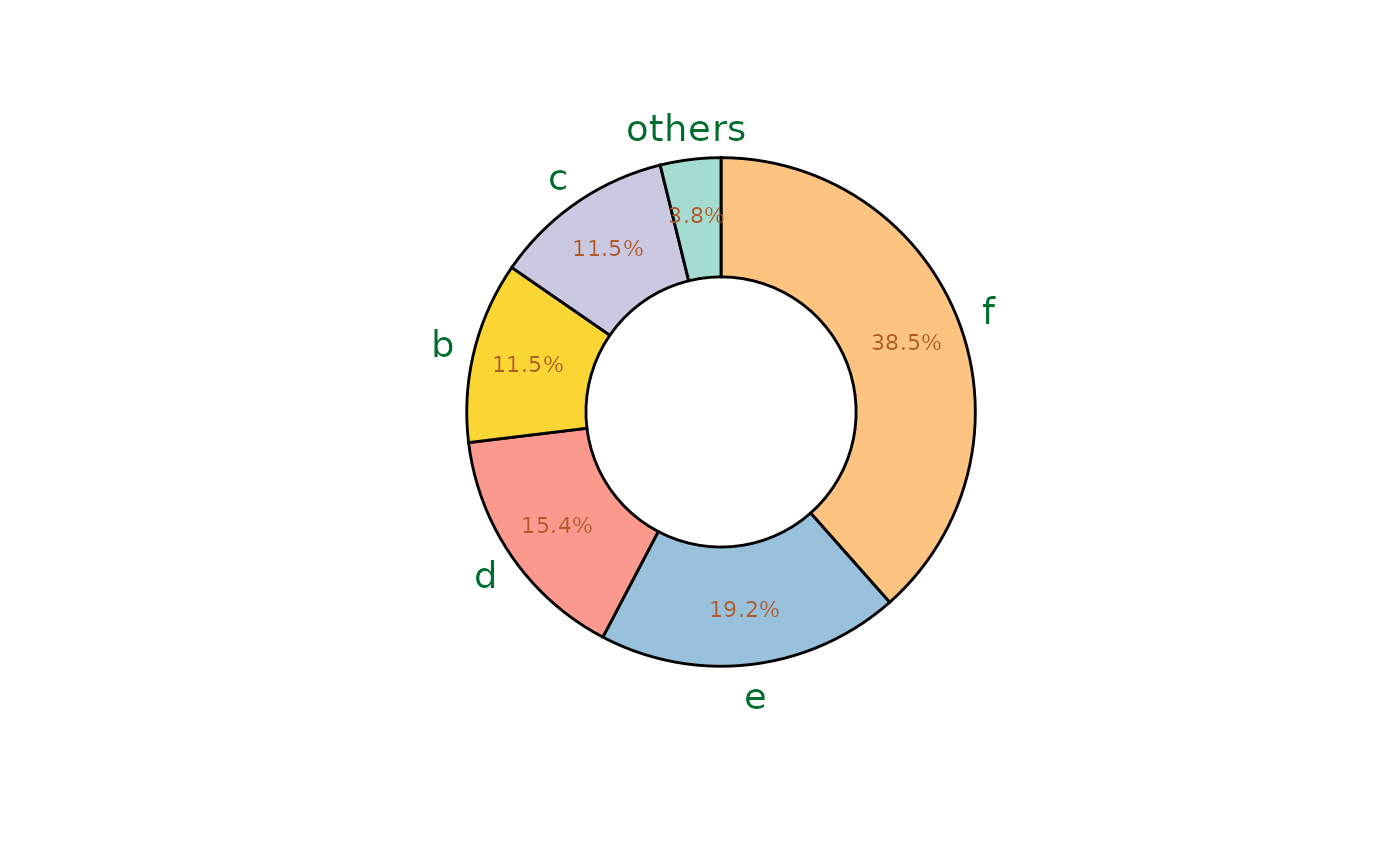
gghuan(a,
  bar_params = list(col = "black"),
  text_params = list(col = "#b15928", size = 3),
  text_params2 = list(col = "#006d2c", size = 5)
) + scale_fill_pc()

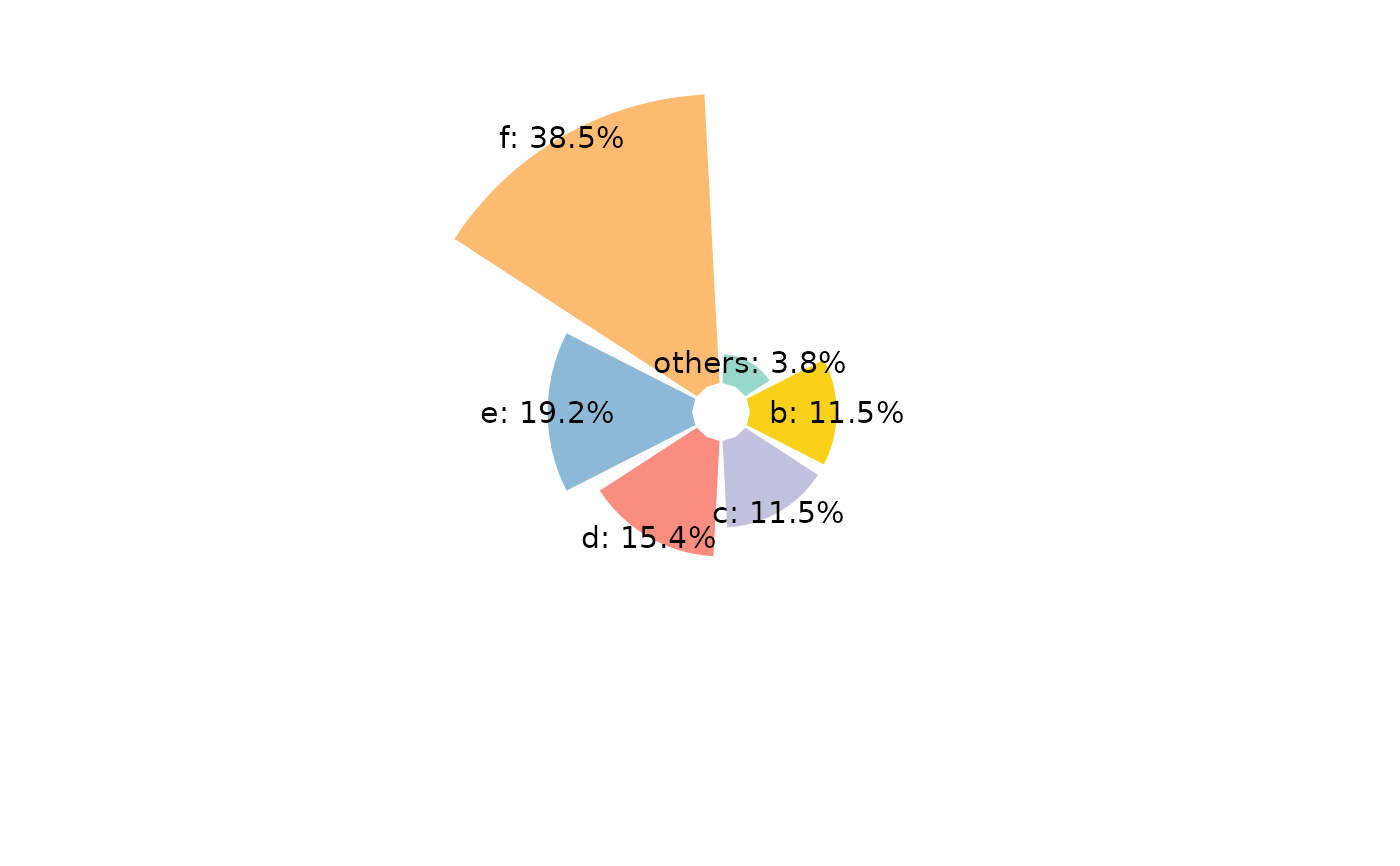
gghuan(a, mode = 2) + scale_fill_pc()

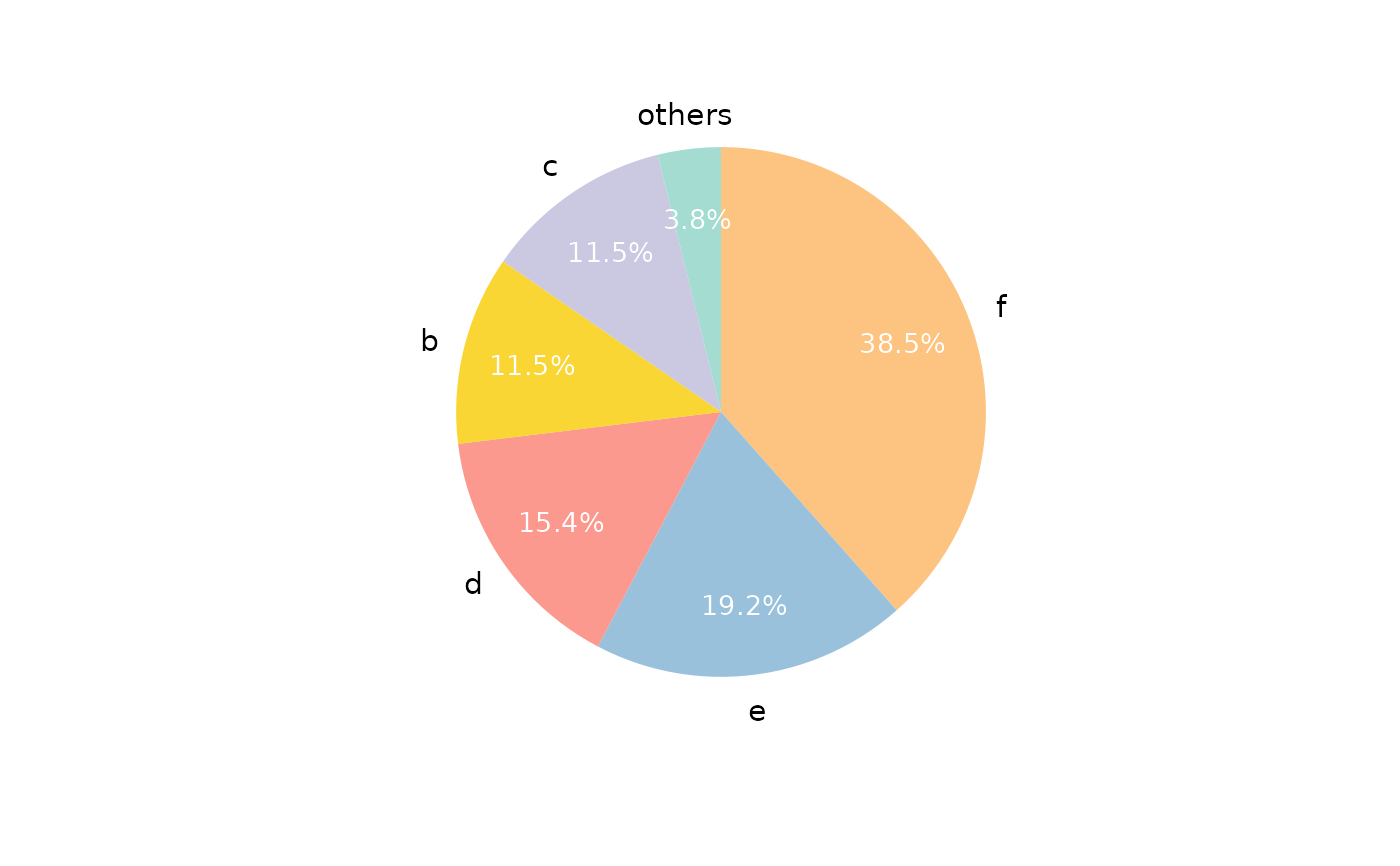
gghuan(a, mode = 3) + scale_fill_pc()
