Rare the sample
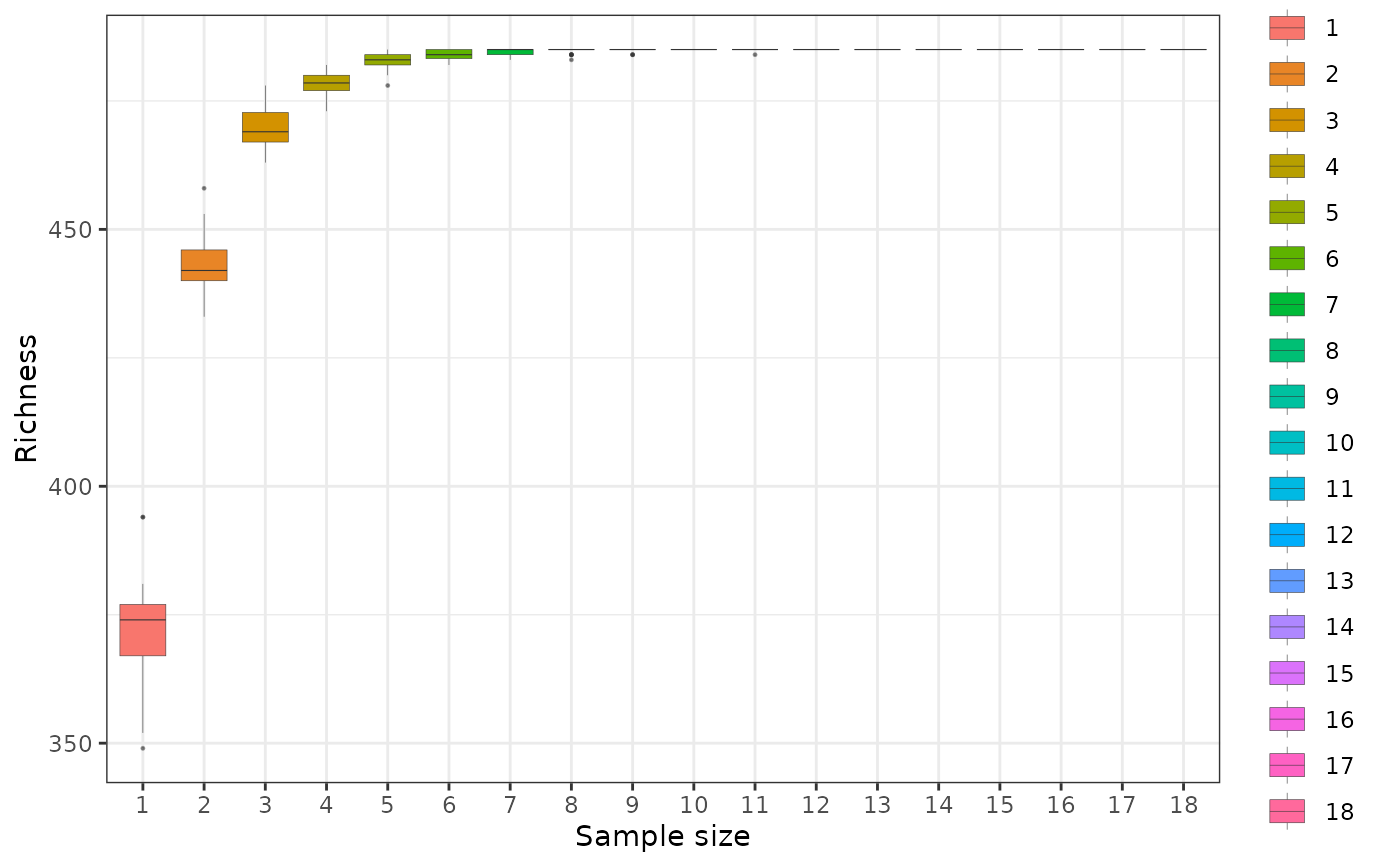
Plot a rare curve
rare_curve_sample(otutab, rep = 30, count_cutoff = 1)

# S3 method for class 'rare_res'
plot(x, ...)Value
ggplot
ggplot
Rare the sample
Plot a rare curve
rare_curve_sample(otutab, rep = 30, count_cutoff = 1)
# S3 method for class 'rare_res'
plot(x, ...)ggplot
ggplot