Plot the N-cycling pathway and genes
Arguments
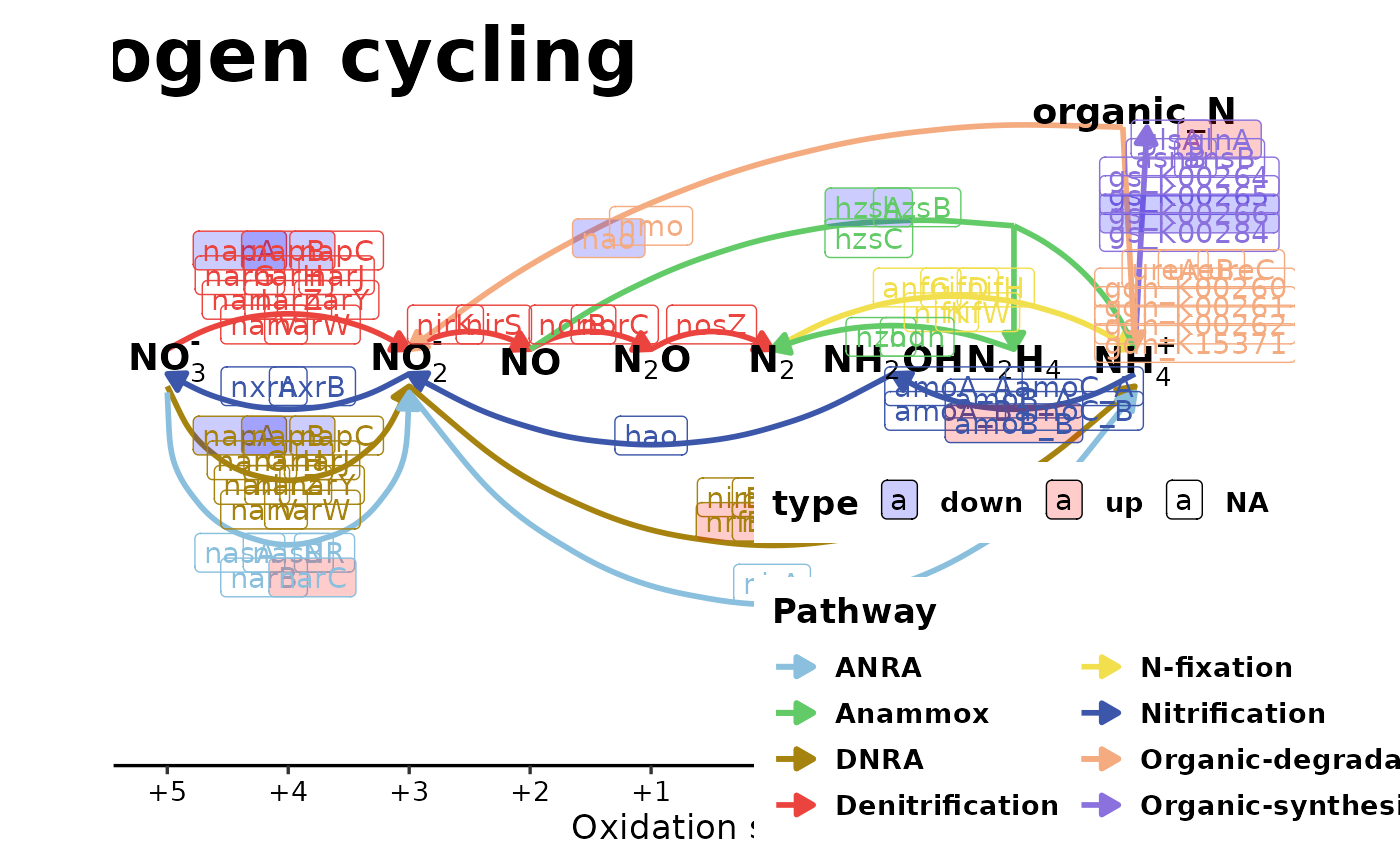
- my_N_genes
dataframe, "Gene_families","type" should in colnames of my_N_genes
- just_diff
logical, just plot the different genes?
- path_col
colors of pathways
- type_col
colors of types
- fill_alpha
alpha, default 0.5
- arrow_size
arrow_size, default 0.1
- line_width
line_width, default 1
- title
title, default "Nitrogen cycling"
- legend.position
default c(0.85,0.15)
Value
ggplot
Examples
N_data <- load_N_data()
#> Joining with `by = join_by(Pathway2)`
my_N_genes <- data.frame(
  `Gene_families` = sample(N_data$N_genes$Gene_families, 10, replace = FALSE),
  change = rnorm(10), check.names = FALSE
)
my_N_genes <- dplyr::mutate(my_N_genes,
  type = ifelse(change > 0, "up", ifelse(change < 0, "down", "none"))
)
plot_N_cycle(my_N_genes, just_diff = FALSE, fill_alpha = 0.2)
#> Joining with `by = join_by(Pathway2)`
#> recommend ggsave(width = 14,height = 10)
#> Joining with `by = join_by(Gene_families)`

# ggsave(filename = "test.pdf", width = 14, height = 10)