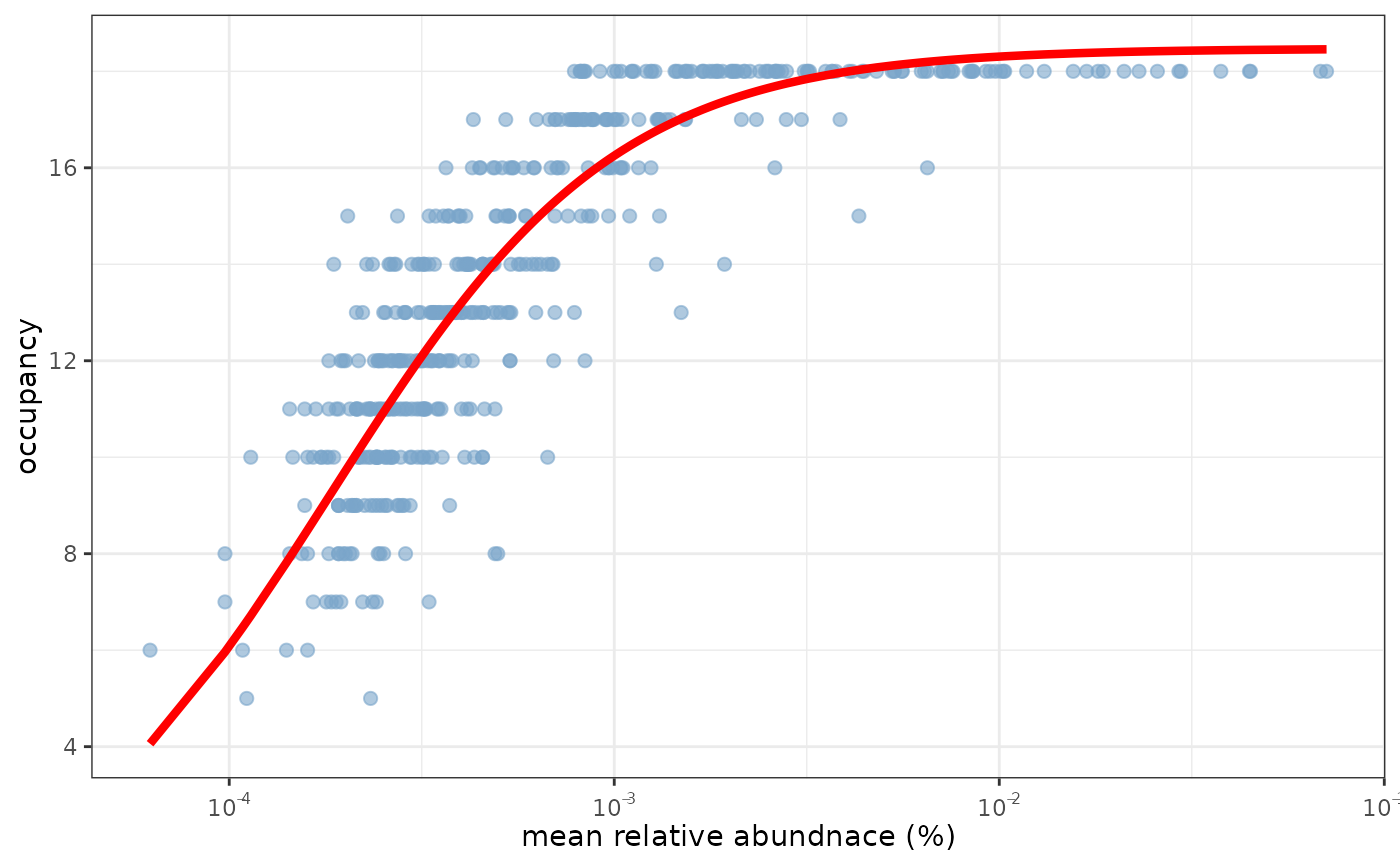
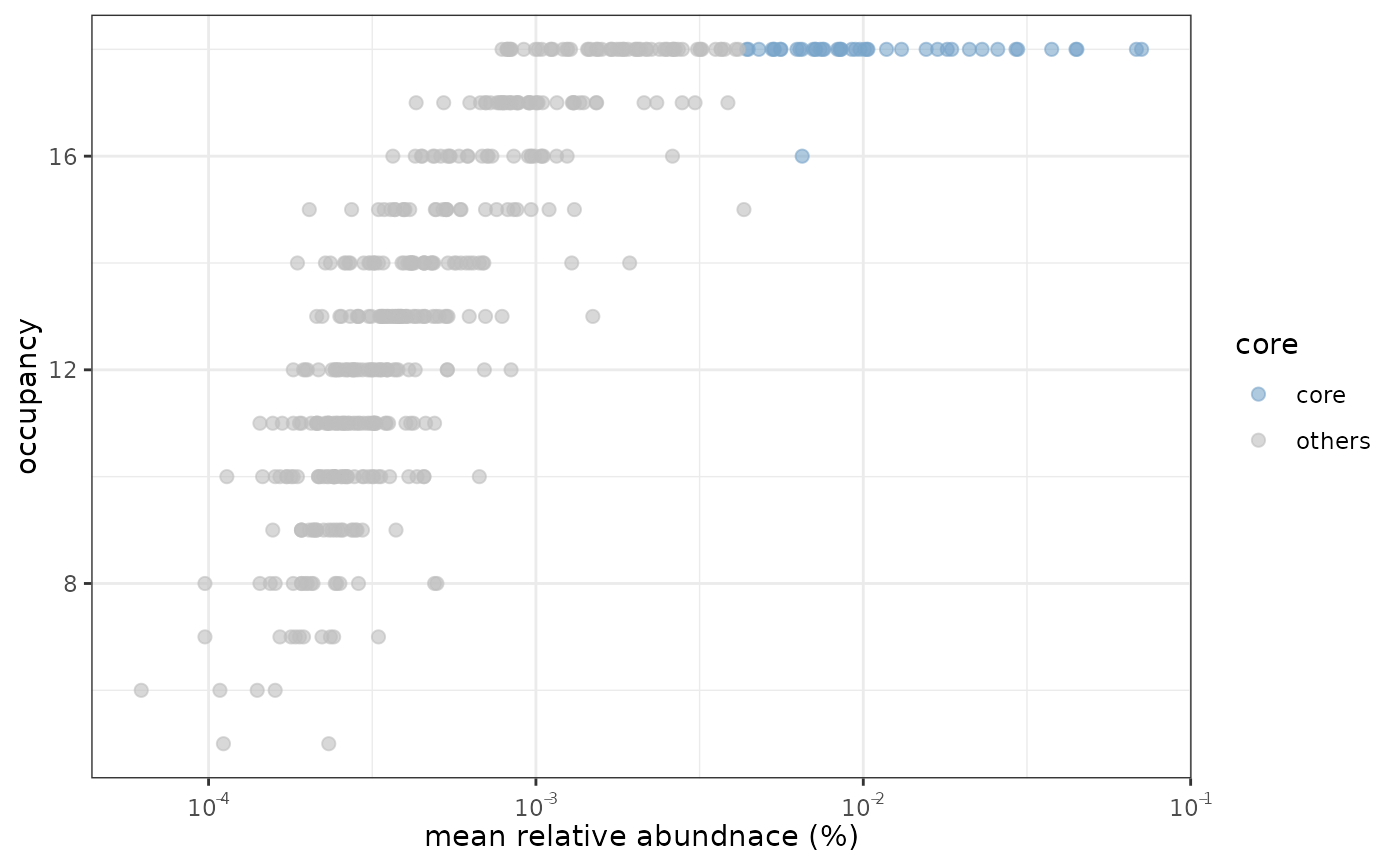
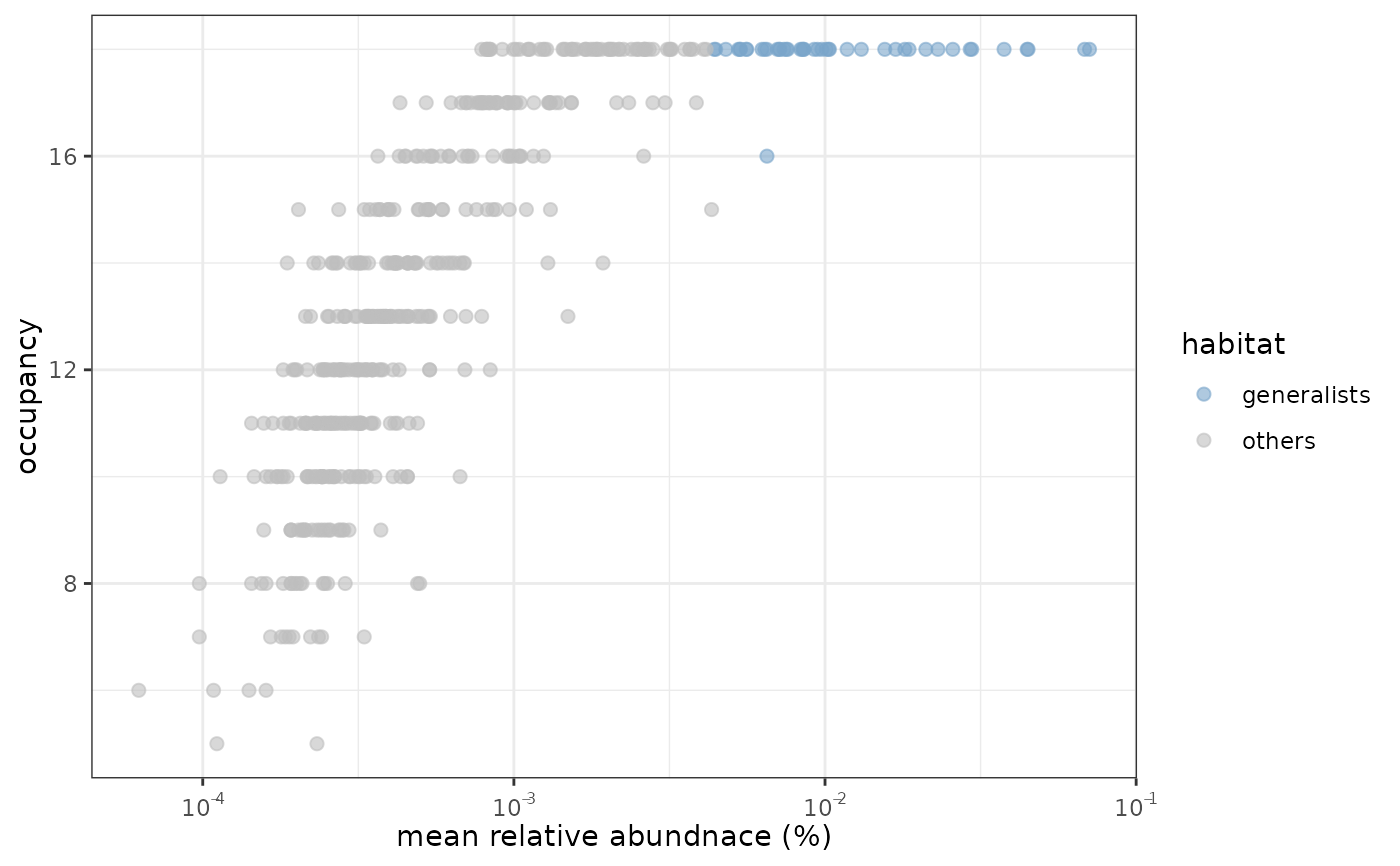
Calculate Abundance-occupancy_relationship
Plot a AOR
Arguments
Value
AOR
ggplot
References
Barberán, A., Bates, S. T., Casamayor, E. & Fierer, N. (2012) Using network analysis to explore co-occurrence patterns in soil microbial communities.
Examples
data(otutab, package = "pcutils")
aor(otutab) -> AOR
plot(AOR)
#> Warning: Using `size` aesthetic for lines was deprecated in ggplot2 3.4.0.
#> ℹ Please use `linewidth` instead.
#> ℹ The deprecated feature was likely used in the pctax package.
#> Please report the issue at <https://github.com/Asa12138/pctax/issues>.
#> [[1]]
 #>
#> [[2]]
#>
#> [[2]]
 #>
#> [[3]]
#>
#> [[3]]
 #>
#>